

As of last month’s writing, the market was mostly just grinding sideways and not doing much. But as March began, so did a conflict in Iran. That wasn’t a catalyst we had considered to bring a more volatile market, but here we are. That being said, the US markets haven’t really sold off too much considering this new environment. The S&P 500 has seen a fairly typical -5% pullback so far, with little sign of panic.
Other events aside, the primary driver in the market at the moment appears to be the spike in the price of oil – a valid metric to be concerned about. The price of oil affects the price of almost everything. But if the spike in price doesn’t last long, then the effects aren’t likely to be too severe. At least not here in the US. But this spike has already done some damage to the strong rallies we were seeing in international markets worldwide. Until this month, many other countries outside the US were showing stronger market environments than they are now.
The Federal Reserve also met earlier this month and held rates as-is for now, but the stock market didn’t seem to like the forward guidance on where the economy could be heading. And even now there appears to be a small possibility of interest rates rising again later this year. Today there is a 20% chance of an increase in September and October. That’s a long way off, and a lot could change between now and then.
Is unemployment still an issue? Sure, but it’s not quite bad enough in the data to suggest bigger issues. Not yet anyway.
Is the market still overvalued (looking at the Shiller PE)? Also yes, but in our opinion, that’s more a point of interest to keep in mind should other factors start to agree, not necessarily something that, on its own, typically drives portfolio decisions.
This month’s chart is a look at the ratio between Large Cap Value (IVE) and Large Cap Growth (IVW). There is a tendency for the market to rise when the Growth side is stronger than the Value side (when the ratio line is rising). And when Value leads, the ratio line falls, and the overall S&P 500 index tends to chop sideways or drift lower. Not always, of course, but often enough to pay attention to it. This ratio peaked at the end of October, and Value has been generally stronger since then, corresponding to this underwhelming market environment.
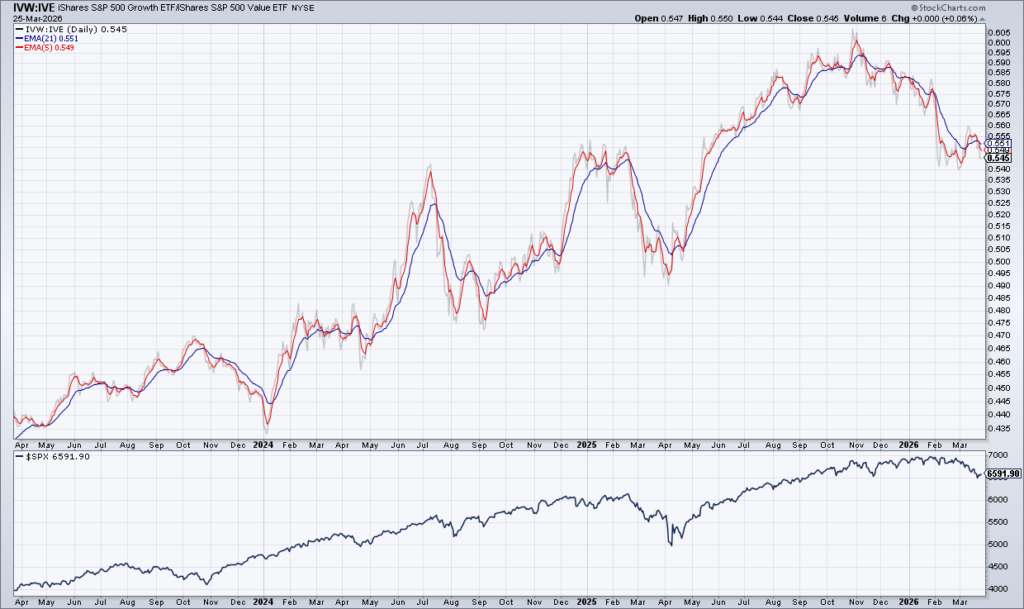
Three-Year chart of Large Cap Growth vs Large Cap Value above the S&P 500 (Source: StockCharts.com)
Our Shadowridge Long-Term Trend indicator finally went negative on March 11th after a long stretch of being positive. Last month there was little reason to be concerned, but now the longer-term data is showing weakness.
Our Mid-Term Cycle indicator turned positive after a deeper dip than we’ve seen in months. For now, we think of it more as a sign for a recovery rally, as long as the Long-Term data remains negative.
As of Wednesday night (March 25th, 2026), our Shadowridge Dashboard showed Positive to Negative market sectors as 1 to 10. The only sector to remain positive, to no surprise, has been Energy. But there are signs of positivity starting to appear on the other sectors that have been negative through the recent market pullback.
Right now, all 10 RGB Bond Indexes are trending negative, all below their 50-day Moving Averages. You would think a few of these bond market segments would be a safe place to hang out during market turbulence, but that hasn’t been the case.
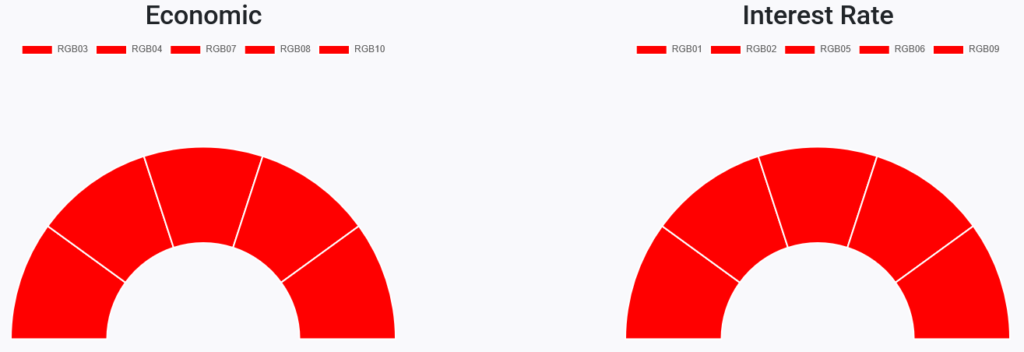
RGB Economic and Interest Rate Sensitive Bond sectors (Source: ShadowridgeData.com)
Traditional Bond sectors are once again correlated with the broad stock market indexes, much as they were during the 2022 bear market. In years past, investors could hide out in US Treasuries as a safer asset while market jitters played out. Even though all of these are trending negatively right now, sectors like Floating Rate are holding up reasonably well compared to other bond areas. And if nothing looks good, Money Market funds are always an option.
Bottom Line: We have maintained a slightly reduced level of stock market exposure since the end of last year, when Value began showing more relative strength than Growth. And until early March, that seemed like enough of a reason to be defensive. Now, the stock market pullback has gotten a little more serious, but we could see a bounce from here. How long that recovery lasts is what we’ll be monitoring to better understand if further defense and reduced market exposure make sense. An interesting concern now is the possibility of an abrupt change in geopolitical conditions could lead to a rapid shift in market sentiment, like what happened at the end of the 2025 “tariff tantrum.” There’s always a trade-off here – stepping back can help manage downside, but it can also mean missing part of a rebound if things turn quickly.
Stay safe out there!
Important Disclosure Information
Please remember that past performance is no guarantee of future results. Different types of investments involve varying degrees of risk, and there can be no assurance that the future performance of any specific investment, investment strategy, or product (including the investments and/or investment strategies recommended or undertaken by Shadowridge Asset Management, LLC [“Shadowridge]), or any non-investment related content, made reference to directly or indirectly in this commentary will be profitable, equal any corresponding indicated historical performance level(s), be suitable for your portfolio or individual situation, or prove successful. Due to various factors, including changing market conditions and/or applicable laws, the content may no longer be reflective of current opinions or positions. Moreover, no portion of the foregoing content serves as the receipt of, or a substitute for, personalized investment advice from Shadowridge. Neither Shadowridge’s investment adviser registration status, nor any amount of prior experience or success, should be construed that a certain level of results or satisfaction will be achieved if Shadowridge is engaged, or continues to be engaged, to provide investment advisory services. Shadowridge is neither a law firm, nor a certified public accounting firm, and no portion of the commentary content should be construed as legal or accounting advice. A copy of the Shadowridge’s current written disclosure Brochure and Form CRS discussing our advisory services and fees continues to remain available upon request or at www.shadowridgeinvest.com. Please Remember: If you are a Shadowridge client, please contact Shadowridge, in writing, if there are any changes in your personal/financial situation or investment objectives for the purpose of reviewing/evaluating/revising our previous recommendations and/or services, or if you would like to impose, add, or to modify any reasonable restrictions to our investment advisory services. Unless, and until, you notify us, in writing, to the contrary, we shall continue to provide services as we do currently. Please Also Remember to advise us if you have not been receiving account statements (at least quarterly) from the account custodian.
Historical performance results for investment indices, benchmarks, and/or categories have been provided for general informational/comparison purposes only, and generally do not reflect the deduction of transaction and/or custodial charges, the deduction of an investment management fee, nor the impact of taxes, the incurrence of which would have the effect of decreasing historical performance results. It should not be assumed that your Shadowridge account holdings correspond directly to any comparative indices or categories. Please Also Note: (1) comparative benchmarks/indices may be more or less volatile than your Shadowridge accounts; and, (2) a description of each comparative benchmark/index is available upon request or at www.shadowridgeinvest.com.