

October continued the slightly choppy, but relatively quiet movement we saw for much of September. For one the months that is historically the “scariest,” it has turned out to be pretty tame so far. With the U.S. election just around the corner, it appears many traders are waiting for that event to pass before buying or selling with much conviction.
Historically, as I’ve mentioned before, November in the second year of a presidential cycle tends to be strong through the following summer, usually into June. We’re optimistic this trend can repeat again this year, but nothing is certain. If our trend indicators can stay positive, then we look forward to taking advantage of this movement. These remain average historical patterns only, and past strength is no guarantee.
The Federal Reserve met again this week and left rates unchanged, as expected. We still watch the 2-year Treasury yield for clues on where rates may head next, and right now, it is pointing higher. The CME FedWatch tool is also pricing in a 0.25% rate hike at the December meeting with about a 78% probability. We tend to agree with that view.
This month’s chart looks at the NYSE New Lows data and compares it to the S&P 500 ETF (SPY). Typically when the New Lows fall below the 100 (Red) line, the market tends to get pulled down with it. But in late September and early October, we saw New Lows drop into the 400s and the broad market didn’t seem to react at all. An unusual scenario for sure.
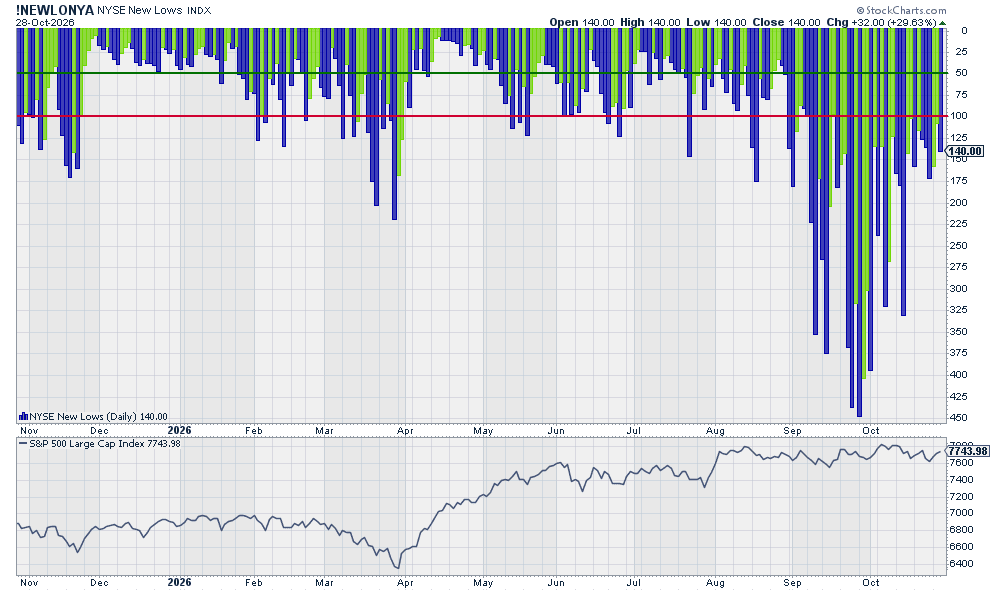
One-Year chart of the NYSE New Lows Index compared to the S&P 500 ETF (SPY) (Source: StockCharts.com)
Our Shadowridge Long-Term Trend indicator remains negative since August 31st, and appears to be having trouble making the turn back into positive.
Our Mid-Term Cycle indicator turned positive in early October, but the market hasn’t moved as much as the data would normally suggest.
As of Wednesday night (October 28th, 2026), our Shadowridge Dashboard showed Positive to Negative market sectors as 8 to 3. Technology (on the negative side) seems to have enough of a negative pull to offset a large part of the rest of the market.
Six of the Ten RGB Bond Indices are trending positive, above their 50-day Moving Average. This is showing a strong recovery in the Interest Rate side of the bond market in recent weeks. However the charts are suggesting to us that the Interest Rate side may struggle to stay positive in the near future.
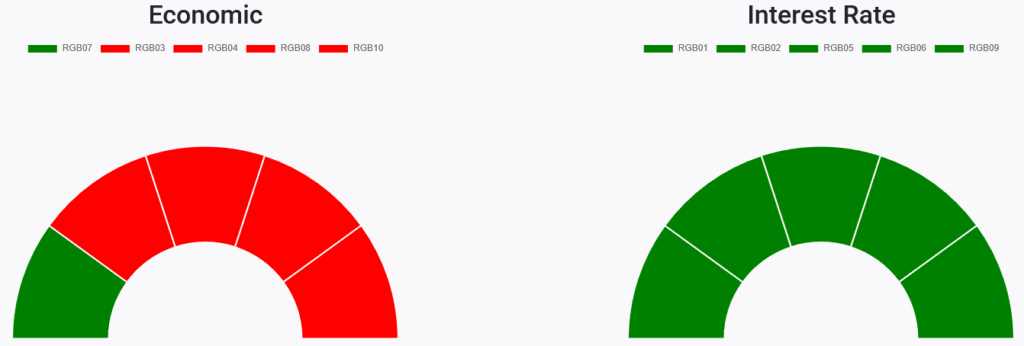
RGB Economic and Interest Rate Sensitive Bond sectors (Source: ShadowridgeData.com)
The beginning of October saw a strong rebound in the traditional, interest-rate-sensitive bond sectors. And with that, some of the safer economic side of the bond market took a small hit, but that appears to be stabilizing now. What we’re watching closely is whether the more traditional and aggregate bond sectors can continue their recovery, or if they roll over. It’s too early to tell, but for now we’re staying cautious.
Bottom line: October stayed relatively quiet as traders waited on election results. Historically, November of the second year of a presidential cycle has tended to be strong into the following summer, and we’re optimistic that can happen again, though nothing is certain. The Fed held rates steady, with signs pointing toward a possible December hike. In bonds, traditional sectors rebounded while the safer economic side took a small hit that now looks to be stabilizing. It’s too early to tell if the recovery holds, so for now we’re staying cautious.
Stay safe out there!
Important Disclosure Information
Please remember that past performance is no guarantee of future results. Different types of investments involve varying degrees of risk, and there can be no assurance that the future performance of any specific investment, investment strategy, or product (including the investments and/or investment strategies recommended or undertaken by Shadowridge Asset Management, LLC [“Shadowridge]), or any non-investment related content, made reference to directly or indirectly in this commentary will be profitable, equal any corresponding indicated historical performance level(s), be suitable for your portfolio or individual situation, or prove successful. Due to various factors, including changing market conditions and/or applicable laws, the content may no longer be reflective of current opinions or positions. Moreover, no portion of the foregoing content serves as the receipt of, or a substitute for, personalized investment advice from Shadowridge. Shadowridge Asset Management, LLC is an investment adviser registered with the Securities and Exchange Commission. Neither Shadowridge’s investment adviser registration status, nor any amount of prior experience or success, should be construed that a certain level of results or satisfaction will be achieved if Shadowridge is engaged, or continues to be engaged, to provide investment advisory services. Shadowridge is neither a law firm, nor a certified public accounting firm, and no portion of the commentary content should be construed as legal or accounting advice. A copy of the Shadowridge’s current written disclosure Brochure and Form CRS discussing our advisory services and fees continues to remain available upon request or at www.shadowridgeinvest.com. Please Remember: If you are a Shadowridge client, please contact Shadowridge, in writing, if there are any changes in your personal/financial situation or investment objectives for the purpose of reviewing/evaluating/revising our previous recommendations and/or services, or if you would like to impose, add, or to modify any reasonable restrictions to our investment advisory services. Unless, and until, you notify us, in writing, to the contrary, we shall continue to provide services as we do currently. Please Also Remember to advise us if you have not been receiving account statements (at least quarterly) from the account custodian.
Historical performance results for investment indices, benchmarks, and/or categories have been provided for general informational/comparison purposes only, and generally do not reflect the deduction of transaction and/or custodial charges, the deduction of an investment management fee, nor the impact of taxes, the incurrence of which would have the effect of decreasing historical performance results. It should not be assumed that your Shadowridge account holdings correspond directly to any comparative indices or categories. Please Also Note: (1) comparative benchmarks/indices may be more or less volatile than your Shadowridge accounts; and, (2) a description of each comparative benchmark/index is available upon request or at www.shadowridgeinvest.com.