

So far, the broad markets are off to a “meh” start to the year with the S&P 500 index sitting very close to where it started in January. And while the big tech names that drove most of the upside we’ve seen over the past few years are getting hit the hardest, some parts of the market (Large Cap Value, International, and Small Caps for example) look good by comparison so far this year.
For a few months now we have been highlighting this shift from Growth to Value, which can be useful in understanding market context. When Growth leads, it tends to be a sign of strength for the overall market and economy. And when Value leads, it tends to be a time for caution. That doesn’t necessarily mean the market is falling, but that expectations for continued growth are muted. In some cases, like 2022, it can signal broad weakness. But for now, that doesn’t seem to be the case.
Is the stock market overvalued here? Possibly. As measured by the Shiller CAPE PE ratio, it is at its 2nd highest value after the Tech bubble of 2000. But again, the stock market can stay overvalued for a while. So for now, we need to keep close tabs on market shifts that can confirm the stock market movement is heading downward.
Unemployment is another factor we’re watching for signs of trouble in the economy. There is much speculation right now about if or when AI will start taking jobs. And while that needs to be considered, it may actually hit the tech and software sectors first. Having spent some time learning about “Vibe Coding,” I can see how the coding and programming jobs could see trouble.
This month’s chart is a look at the Shiller PE ratio I mentioned earlier. Sometimes the visual makes more sense than just mentioning it, so there it is. Current value is 39.78 and the all-time high was just under 45. Is the market overvalued? Sure. Does that mean that it’s time for a bear market? Nope. The Shiller PE is one of many data points to keep in mind to understand where we are and where the market could go from here. I thought it was worth the mention.
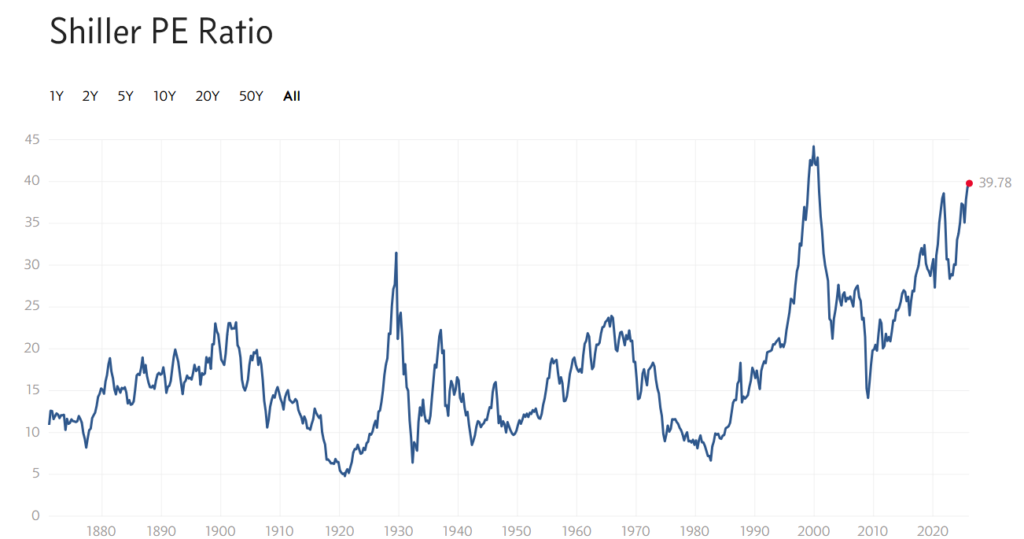
Shiller CAPE Ratio, 1881-2026 (Source: multpl.com/shiller-pe)
Our Shadowridge Long-Term Trend indicator remains positive this year with little signs of slowing down. With this trend in-tact, we believe there is little reason to be concerned about the market right now.
Our Mid-Term Cycle indicator just turned negative, but the data has been choppy and not trending enough in either direction. For now we’re just counting it as a mixed-signal but will keep a close eye on it if it starts to accelerate either way.
As of Wednesday night (February 24th, 2026), our Shadowridge Dashboard showed Positive to Negative market sectors as 7 to 4. This is also giving us mixed signals. The sectors that tend to dive the market higher are the ones stuck on the negative side: Tech, Financials, Consumer Discretionary, and Communications. Based on our data, if these start moving to the positive column, then we’d expect the market to rally.
Right now, 9 RGB Bond Indexes are trending positive, above their 50-day Moving Averages. Strength has shifted to lean toward the Interest Rate sensitive bond sectors. The one negative bond sector right now is Floating Rate – which has been a favorite of ours over the past few years. We noticed this earlier and swapped out this holding when it wasn’t acting as expected in our models.
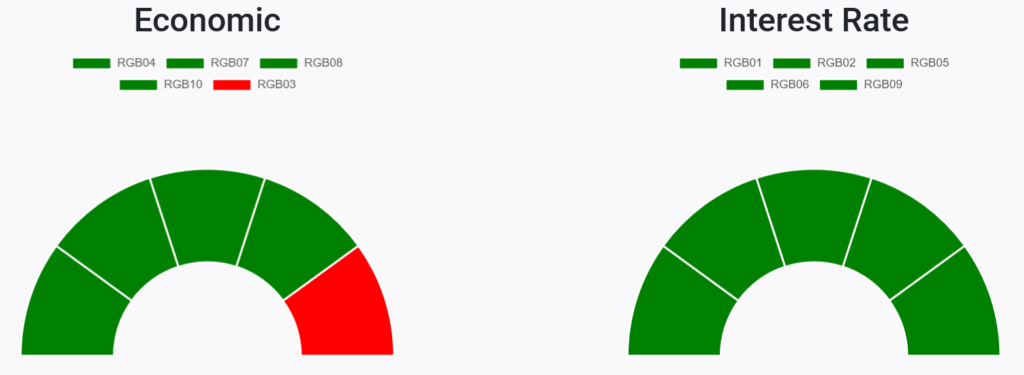
RGB Economic and Interest Rate Sensitive Bond sectors (Source: ShadowridgeData.com)
Traditional Bond sectors are starting to wake up again as the market is getting more volatile. This was not what we saw last time the market corrected in 2022 – when the broad bond market fell almost as hard as the stock market. And while our favorite sector (Floating Rate) isn’t as strong as it has been, in some cases we’ve shifted into High Yield and Emerging Market bonds. Those two bond sectors seem to show the most strength for now.
Bottom Line: We’ve been shifting from lagging sectors to strength as needed in our models to stay on top of where we’re seeing strength. Some factors have us cautious for the future, but for now, the bullish case still holds. And while I’m personally not super bullish on the year – I think we end the year somewhat flat – I hope to be proved wrong, because what I think doesn’t matter as much as what I do in regards to participating in the parts of the market that are trending.
Stay safe out there!
Important Disclosure Information
Please remember that past performance is no guarantee of future results. Different types of investments involve varying degrees of risk, and there can be no assurance that the future performance of any specific investment, investment strategy, or product (including the investments and/or investment strategies recommended or undertaken by Shadowridge Asset Management, LLC [“Shadowridge]), or any non-investment related content, made reference to directly or indirectly in this commentary will be profitable, equal any corresponding indicated historical performance level(s), be suitable for your portfolio or individual situation, or prove successful. Due to various factors, including changing market conditions and/or applicable laws, the content may no longer be reflective of current opinions or positions. Moreover, no portion of the foregoing content serves as the receipt of, or a substitute for, personalized investment advice from Shadowridge. Neither Shadowridge’s investment adviser registration status, nor any amount of prior experience or success, should be construed that a certain level of results or satisfaction will be achieved if Shadowridge is engaged, or continues to be engaged, to provide investment advisory services. Shadowridge is neither a law firm, nor a certified public accounting firm, and no portion of the commentary content should be construed as legal or accounting advice. A copy of the Shadowridge’s current written disclosure Brochure and Form CRS discussing our advisory services and fees continues to remain available upon request or at www.shadowridgeinvest.com. Please Remember: If you are a Shadowridge client, please contact Shadowridge, in writing, if there are any changes in your personal/financial situation or investment objectives for the purpose of reviewing/evaluating/revising our previous recommendations and/or services, or if you would like to impose, add, or to modify any reasonable restrictions to our investment advisory services. Unless, and until, you notify us, in writing, to the contrary, we shall continue to provide services as we do currently. Please Also Remember to advise us if you have not been receiving account statements (at least quarterly) from the account custodian.
Historical performance results for investment indices, benchmarks, and/or categories have been provided for general informational/comparison purposes only, and generally do not reflect the deduction of transaction and/or custodial charges, the deduction of an investment management fee, nor the impact of taxes, the incurrence of which would have the effect of decreasing historical performance results. It should not be assumed that your Shadowridge account holdings correspond directly to any comparative indices or categories. Please Also Note: (1) comparative benchmarks/indices may be more or less volatile than your Shadowridge accounts; and, (2) a description of each comparative benchmark/index is available upon request or at www.shadowridgeinvest.com.