

This slow grind higher continues! July tends to be a strong month for the US Indexes according to seasonality, and it did grind higher, just not very quickly. But looking at seasonality, August is where things could get interesting. Or at the very least, more volatile.
The market seems to care much less about tariffs or fighting in the middle east than it did previously. Lately, headlines that would have caused big swings as recently as April or May of this year are almost completely ignored. And looking at the VIX (Volatility Index – that I showed in my July market commentary video), the reading is relatively low – suggesting there isn’t much fear in the market expected over the next 30 days.
Unemployment is still on our radar as it could signal an eventual recession. But for now, that data remains calm. We’re still keeping in mind the yield curve un-inverting, but that projects out many months in advance. So there is still time for that scenario to be in our future. And maybe the tariff situation is ultimately the match that will light the recession fire. For now, it still seems too early to tell.
This month’s chart is the VIX Volatility Index mentioned above. The green horizontal line is at 16, where expected movement of the S&P 500 is around 1% (or less) over the next 30 days. With the VIX index trending lower and is now below that green line, that suggests to us that fear is minimal. But what we need to be aware of is any break back above this line and/or across the 21-day moving average (blue line). If we see that movement, that is when we’d start to look for news items to create more movement in the broad markets.
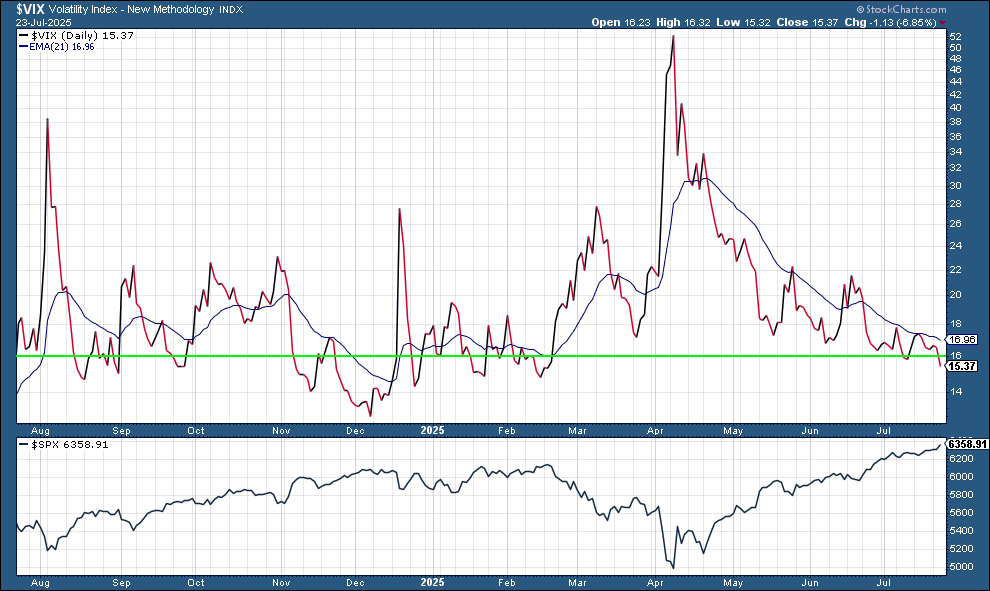
One-year VIX Volatility Index with 21 EMA above the S&P 500 Index (Source: StockCharts.com)
Our Shadowridge Long-Term Trend indicator remains positive since April 24th and has remained steadily higher since that date. Sure, there have been some small bumps in the road, but nothing to cause concern from this data.
Our Mid-Term Cycle indicator went back to positive on Wednesday this week (July 23rd, 2025) after pushing below the -200 line (see our monthly videos). That tends to suggest money is ready to come back into the market and push prices higher.
As of Wednesday night (July 23rd, 2025), our Shadowridge Dashboard showed Positive to Negative market sectors as 11 to 0. So now there is broad agreement that the market trend is positive across all the parts that make up the S&P 500 index. Generally, this is a positive sign until we start to see weakness creep in. But for now, this data looks positive.
Right now, 8 RGB Bond Indexes are trending positive above their 50-day Moving Averages. The weak bond sectors at the moment are the Muni and High Yield Muni indexes. Both have struggled this year while the Economic Sensitive bond sectors remained strong. That is also a positive note for the broad economy and stock market…for now.
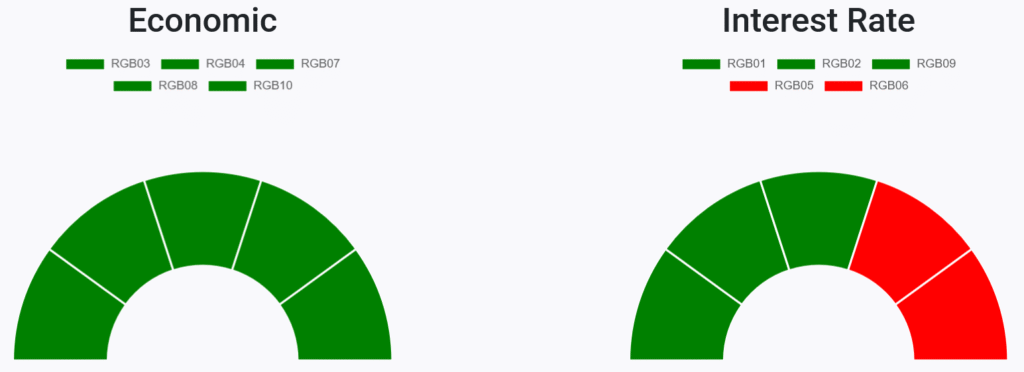
RGB Economic and Interest Rate Sensitive Bond sectors (Source: ShadowridgeData.com)
As I said above, some of the bond sectors are not doing well this year. But the strongest areas are still in High Yield and Bank Loan areas over the traditional Aggregate or US Treasury. Certainly on a risk-adjusted basis the Economically Sensitive side meets this criteria, so that is where we’ve been leaning when looking for lower risk holdings.
Bottom Line: July lived up the positive seasonality expectations as I mentioned last month. But once we get into August, the market can get more volatile. With the strong run-up we’ve seen off the “Tariff Tantrum” from earlier this year, if the market took a break for a bit, that would still be constructive for a longer-term positive trend. As always, we have to be aware of possible clouds or storms on the horizon. But for now, the skies are clear.
Stay safe out there!
Important Disclosure Information
Please remember that past performance is no guarantee of future results. Different types of investments involve varying degrees of risk, and there can be no assurance that the future performance of any specific investment, investment strategy, or product (including the investments and/or investment strategies recommended or undertaken by Shadowridge Asset Management, LLC [“Shadowridge]), or any non-investment related content, made reference to directly or indirectly in this commentary will be profitable, equal any corresponding indicated historical performance level(s), be suitable for your portfolio or individual situation, or prove successful. Due to various factors, including changing market conditions and/or applicable laws, the content may no longer be reflective of current opinions or positions. Moreover, no portion of the foregoing content serves as the receipt of, or a substitute for, personalized investment advice from Shadowridge. Neither Shadowridge’s investment adviser registration status, nor any amount of prior experience or success, should be construed that a certain level of results or satisfaction will be achieved if Shadowridge is engaged, or continues to be engaged, to provide investment advisory services. Shadowridge is neither a law firm, nor a certified public accounting firm, and no portion of the commentary content should be construed as legal or accounting advice. A copy of the Shadowridge’s current written disclosure Brochure and Form CRS discussing our advisory services and fees continues to remain available upon request or at www.shadowridgeinvest.com. Please Remember: If you are a Shadowridge client, please contact Shadowridge, in writing, if there are any changes in your personal/financial situation or investment objectives for the purpose of reviewing/evaluating/revising our previous recommendations and/or services, or if you would like to impose, add, or to modify any reasonable restrictions to our investment advisory services. Unless, and until, you notify us, in writing, to the contrary, we shall continue to provide services as we do currently. Please Also Remember to advise us if you have not been receiving account statements (at least quarterly) from the account custodian.
Historical performance results for investment indices, benchmarks, and/or categories have been provided for general informational/comparison purposes only, and generally do not reflect the deduction of transaction and/or custodial charges, the deduction of an investment management fee, nor the impact of taxes, the incurrence of which would have the effect of decreasing historical performance results. It should not be assumed that your Shadowridge account holdings correspond directly to any comparative indices or categories. Please Also Note: (1) comparative benchmarks/indices may be more or less volatile than your Shadowridge accounts; and, (2) a description of each comparative benchmark/index is available upon request or at www.shadowridgeinvest.com.