
As we close out 2025, it’s hard not to notice how different the end of the year looks compared to how it began.
The first few months were volatile by any standard. At one point, the S&P 500 experienced a nearly -20% drawdown, while both the Small Cap Index and the NASDAQ 100 were down -22% or more. That kind of start tends to test confidence, even for experienced investors.
Against that backdrop, seeing these same indexes about to finish the year up in the mid-to-high teens is impressive. At the same time, it’s worth noting that most major indexes peaked in late October and have struggled to make new highs for nearly 38 trading days. That kind of market behavior doesn’t necessarily signal trouble, but it does suggest conditions are changing and warrant caution.
Also, even though it appears that 2025 will end up positive, it was not a year where outcomes were evenly distributed. More on that later.
What We Focused on This Year — and Why It Matters
Behind the scenes at Shadowridge, 2025 was a year of refinement. Our goal wasn’t to reinvent what we do. It was to clarify it. Here are some of the things we have been doing over the past year and how they matter to you.
Improving Technology and Reporting
We made the decision to discontinue using our previous reporting platform, Orion, due to outdated and occasionally inaccurate data. Clear reporting matters, and accuracy is non-negotiable.
In its place, we are developing new reports built on clean data that are designed to be clear at a glance and focused on the information that matters most to you. Looking ahead, we are also working toward a client portal that will allow you to view everything in one place in a simple and intuitive format.
Streamlining Our Investment Strategies
This year we did a deep review of our investment strategies to evaluate what’s working, what isn’t, and opportunities to create greater efficiency. We noticed that some signals and data that had worked for over a decade were becoming unreliable and we saw the opportunity to adjust and realign what we do.
With the help of Chad Karnes, CMT, we performed a deep analysis of our strategies. The result was a more streamlined set of strategies designed to be clearer, more efficient, and easier to manage through volatility. When the next meaningful correction occurs, we believe this foundation puts us in an even better position to respond and achieve our primary objective – to protect investors’ money in a downturn.
Prioritizing Low Volatility
One of the consistent lessons we’ve learned from market history is that managing volatility is often one of the most effective ways to achieve financial goals. While this approach can feel counterintuitive, especially when more aggressive and higher volatility strategies are profiting, it has tended to produce more reliable outcomes over time.
Low-volatility investing isn’t designed to win every short-term comparison. It’s designed to limit the kinds of losses that can stress most investors out and can lead to detrimental decisions at exactly the wrong time. When the world, and the market, seem to be going mad, low volatility investing can help to add some much-needed sanity.
Our friend Rob Bernstein at RGB Capital Group was an important influence this year, particularly in shaping how we think about managing volatility and drawdowns within portfolios. The objective isn’t to eliminate risk, but to pursue growth in a way that avoids unnecessary stress and protects capital when conditions change.
To further illustrate the differences that a low-volatility approach makes, I’m using the three charts below. Each chart compares two different investment approaches across three different time horizons.
- Red: An example of a traditionally allocated balanced approach.
- Green: A tactical, market-neutral investing approach.
While markets can reward exposure and momentum over shorter periods (especially this year), over longer periods, volatility and drawdowns tend to matter more than most investors expect. These charts are meant to show how those differences can play out over time, not to suggest that one approach is always “better.”
Chart 1: 6-Month Comparison
Short-Term Trends Favor Participation
The chart below illustrates how, during a six-month, low-stress environment, the traditional balanced strategy (red) will tend to outperform. Tactical, market-neutral approaches (green) often lag during these conditions as a tradeoff for reduced exposure and lower volatility.
This is expected behavior, not a failure of the strategy. Reducing volatility typically means giving up some upside when markets are grinding higher.
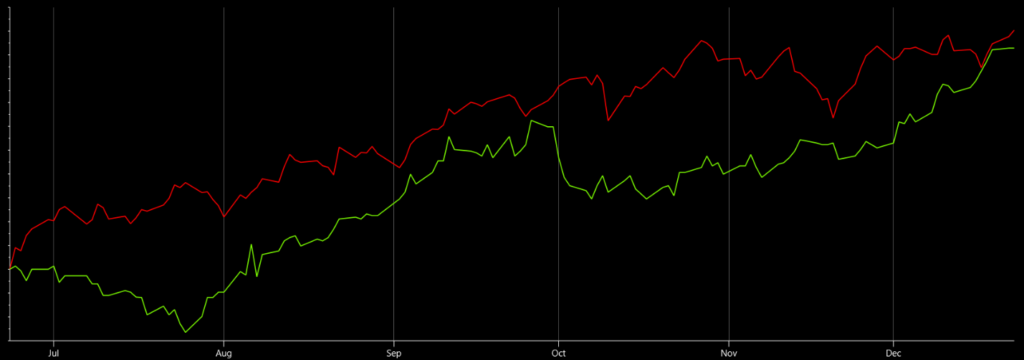
Six-Month comparison of a traditional balanced approach (Red) to a Tactical Market Neutral approach (Green) (Source: FastTrack)
Chart 2: 1-Year Comparison
Volatility Changes the Experience
Over a one-year period that includes elevated volatility, such as the drawdowns experienced earlier this year, the difference becomes less about returns and more about the behavior it creates. Volatility can shake the nerves of any investor and increase the likelihood of reacting at the wrong time.
The tactical, market-neutral strategy (green) experiences smaller drawdowns and a smoother path, while the traditional balanced strategy (red) experiences more volatility.
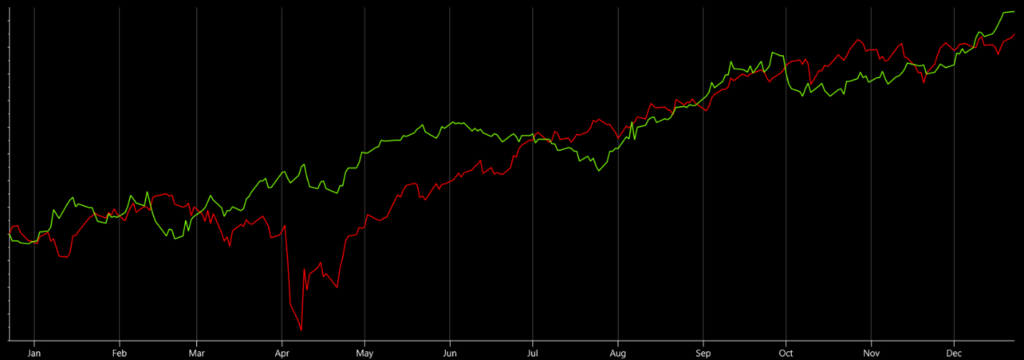
One-Year comparison of a traditional balanced approach (Red) to a Tactical Market Neutral approach (Green) (Source: FastTrack)
Chart 3: 3-Year Comparison
Different Paths, Meaningful Separation
Over a three-year period, the cumulative impact of volatility becomes more obvious. While the traditional balanced strategy (red) continues to participate in market advances, the tactical, market-neutral strategy (green) compounds more steadily, benefiting from smaller drawdowns and greater consistency.
The distinction here isn’t speed, it’s resilience. Managing volatility can create a less stressful path when conditions become challenging.
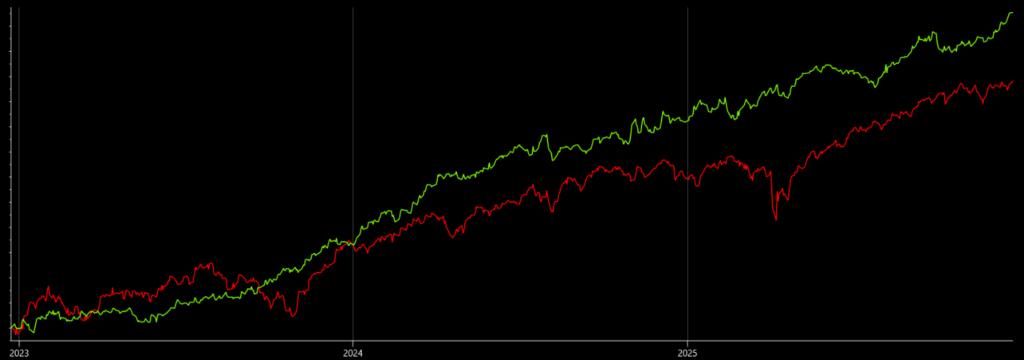
Three-Year comparison of a traditional balanced approach (Red) to a Tactical Market Neutral approach (Green) (Source: FastTrack)
While these examples are theoretical, they reflect how we approached our strategy review this year. The objective was to create a smoother return profile with less volatility. The market-neutral approach is something Will Hepburn and I have been refining since the difficult market environment of 2022. Prior to that period, Treasuries typically served as a reliable risk-off position. When bonds began declining alongside equities, that assumption no longer held. This prompted us to explore alternative ways to manage downside risk, an adjustment that has benefited our investors as Treasuries have struggled to provide meaningful protection since then.
Back to the Data
Our Shadowridge Long-Term Trend indicator remains positive and has been since the late-November market rally.
Our Mid-Term Indicator has been showing weakness since December 8th, but that only means there is less enthusiasm in buying stocks, not that the market can’t still go up. There just isn’t much of a push behind the move right now.
As of Wednesday night (December 24th, 2025), our Shadowridge Dashboard shows Positive-to-Negative market sectors at 4 to 7. The S&P 500 isn’t showing much agreement on near-term direction. We should be seeing a “Santa Claus” rally (the last 5 days of December and the first 2 of January), but at the moment, there isn’t much sign that the move would be very strong if we do get it.
Right now, 9 RGB Bond Indexes are trending positive, above their 50-day Moving Averages. Strength continues to lean toward the Economically sensitive bond sectors. The weak sector is Inflation-Protection Bonds.
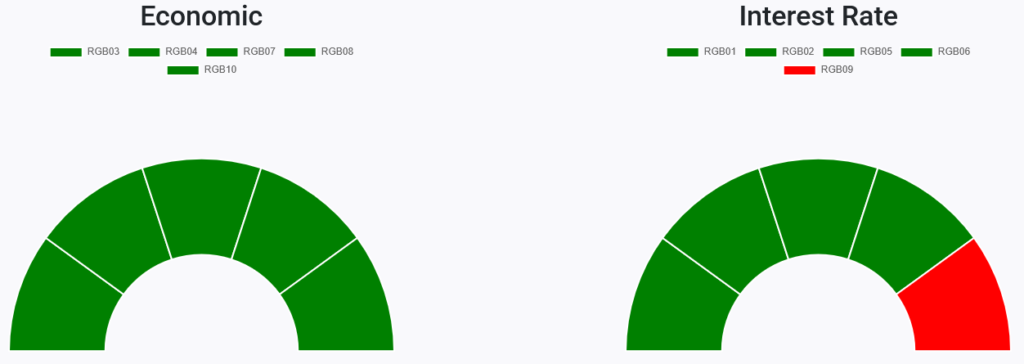
RGB Economic and Interest Rate Sensitive Bond sectors (Source: ShadowridgeData.com)
Closing Thought
We’ve now had a few solidly positive market years in a row, and that is something to celebrate. However, from a sequence-of-events point of view, I’m not confident this streak can continue. Of course, an overbought market can stay overbought, but there are cracks forming that we need to stay aware of. I’ll cover those more next month in both our market commentary video and written newsletters.
Regarding volatility – our view isn’t that volatility should be eliminated or that exposure should always be minimized. It’s that volatility is a real cost, and how it’s managed should be a deliberate choice. We expect this thinking to serve us (and our investors) well next time the market shows weakness. We don’t know exactly when that will occur, but when it does, we will be ready.
Wishing everyone a great Christmas and a Happy New Year!
Stay safe out there!

1 The Standard and Poor’s 500 is an unmanaged, capitalization-weighted benchmark that tracks broad-based changes in the U.S. stock market. This index of 500 common stocks is comprised of 400 industrial, 20 transportation, 40 utility, and 40 financial companies representing major U.S. industry sectors. The index is calculated on a total return basis with dividends reinvested and is not available for direct investment.
2 Charts are for informational purposes only and are not intended to be a projection or prediction of current or future performance of any specific product. All financial products have an element of risk and may experience loss. Past performance is not indicative of future results.