

As we had noted last month, August had the chance to improve on a weak July, and month-to-date that’s what we’ve seen. Several major US markets did peak around August 13th and have drifted lower since. If that drift lower can stay somewhat restrained, then we believe August can still finish positive.
Growth stocks made an attempted comeback in early August, but the Value side is still holding up compared to Growth on Relative Strength. That shift in leadership continues to give us “caution ahead” warnings. But for now, the majority of the market is holding up well enough for us to be fully (or nearly fully) invested.
The other interesting stat to note is that the S&P 500 (SPY ETF) did hit new all-time highs in August, while the NASDAQ 100 (QQQ ETF) did not. As I’ve said in the past, we need the NASDAQ to participate in the up-trends if we want to see meaningful moves higher across the board.
On the positive side, the price of oil (looking at /CL Light Sweet Crude futures) has remained reasonably stable given the Iran situation can’t seem to resolve. The on-again, off-again of the conflict has shown up in crude prices, but they aren’t spiking like they did in March and April this year. One possibility is that investors have grown accustomed to this activity and are largely writing off the volatility. That is where we are right now.
Seasonality in the coming months has two completely different scenarios coming up. September and October have historically been among the more challenging months for equities. That does not mean the pattern will repeat this year, but it is one seasonal factor we continue to monitor. Historically, the November-through-June period following midterm elections has shown stronger average market performance than several other portions of the four-year presidential cycle. I shared a chart of the history on my recent webinar.
This month’s chart compares the iShares Aggregate Bond Index (AGG ETF in Green) with iShares Floating Rate Bond (FLOT ETF in Red) over the past 3 years. I showed these separately on our monthly webinar this past month. My goal with the bond asset class is to help manage risk and volatility (the amount of up and down movement). What we look for in our ETF or Fund selection is a line that looks like the Red one below, and not the Green. For us, the smoother line tends to result in lower stress for our investors. And to clarify, we own neither of these specific ETFs. Rather, this is what our selection process looks like.
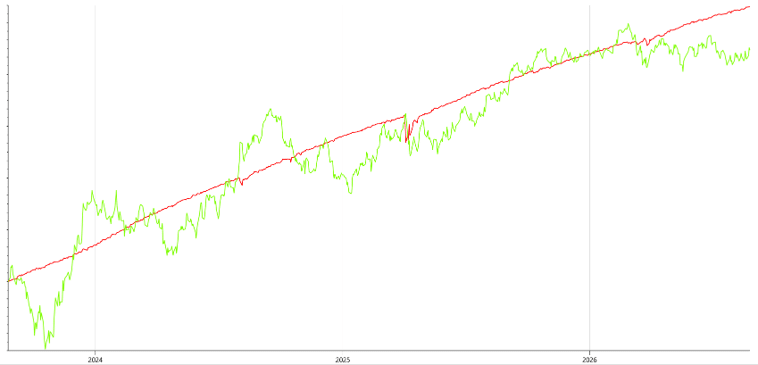
Three-Year chart of AGG and FLOT ETFs (Source: FastTrack.net)
Our Shadowridge Long-Term Trend indicator has remained positive since April 8th, and is holding steady into the end of August.
Our Mid-Term Cycle indicator remains neutral with a very slight negative bias. It remains in a range that isn’t suggesting much conviction in any direction, up or down.
As of Wednesday night (August 27th, 2026), our Shadowridge Dashboard showed Positive to Negative market sectors as 8 to 3. Technology, Industrials and Utilities are the weak sectors at the moment. As I’ve said above, I’d like to see a Growth oriented sector like Tech be on the positive side to give us better odds of a positive S&P 500 run-up.
Eight of the Ten RGB Bond Indices are trending positive, above a 50-day Moving Average. Weakness is currently concentrated in the Muni and High Yield Muni sectors.
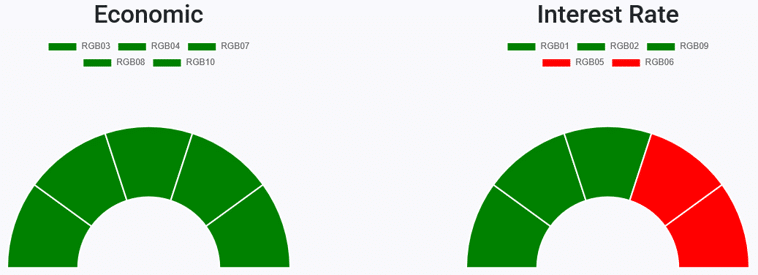
RGB Economic and Interest Rate Sensitive Bond sectors (Source: ShadowridgeData.com)
Traditional Bond sectors continue to add little value to a “diversified” portfolio this year. As of Aug 26, 2026, the 7-10 year Treasuries (IEF) was down -1.09% YTD and the Aggregate Bond Index (AGG) was up 0.44% YTD. We continue to see limited upside in traditional bond sectors and favor others (see the chart above) like Floating Rate and High Yield. Muni bonds, while faring slightly better YTD with Vanguard Tax-Exempt Bond (VTEB) up 0.41%, are showing more volatility with even smaller dividends. It’s tough out there in some of these bond sectors.
Bottom Line: We are happy to see a slight market recovery in August, but some of our key factors continue to suggest not getting too aggressive right now. Seasonality backs that up. Historically, conditions have often become more favorable beginning in November, but we’ll continue to let the data—not the calendar alone—guide any portfolio adjustments. But first, we need to get through September.
Stay safe out there!
Important Disclosure Information
Please remember that past performance is no guarantee of future results. Different types of investments involve varying degrees of risk, and there can be no assurance that the future performance of any specific investment, investment strategy, or product (including the investments and/or investment strategies recommended or undertaken by Shadowridge Asset Management, LLC [“Shadowridge]), or any non-investment related content, made reference to directly or indirectly in this commentary will be profitable, equal any corresponding indicated historical performance level(s), be suitable for your portfolio or individual situation, or prove successful. Due to various factors, including changing market conditions and/or applicable laws, the content may no longer be reflective of current opinions or positions. Moreover, no portion of the foregoing content serves as the receipt of, or a substitute for, personalized investment advice from Shadowridge. Neither Shadowridge’s investment adviser registration status, nor any amount of prior experience or success, should be construed that a certain level of results or satisfaction will be achieved if Shadowridge is engaged, or continues to be engaged, to provide investment advisory services. Shadowridge is neither a law firm, nor a certified public accounting firm, and no portion of the commentary content should be construed as legal or accounting advice. A copy of the Shadowridge’s current written disclosure Brochure and Form CRS discussing our advisory services and fees continues to remain available upon request or at www.shadowridgeinvest.com. Please Remember: If you are a Shadowridge client, please contact Shadowridge, in writing, if there are any changes in your personal/financial situation or investment objectives for the purpose of reviewing/evaluating/revising our previous recommendations and/or services, or if you would like to impose, add, or to modify any reasonable restrictions to our investment advisory services. Unless, and until, you notify us, in writing, to the contrary, we shall continue to provide services as we do currently. Please Also Remember to advise us if you have not been receiving account statements (at least quarterly) from the account custodian.
Historical performance results for investment indices, benchmarks, and/or categories have been provided for general informational/comparison purposes only, and generally do not reflect the deduction of transaction and/or custodial charges, the deduction of an investment management fee, nor the impact of taxes, the incurrence of which would have the effect of decreasing historical performance results. It should not be assumed that your Shadowridge account holdings correspond directly to any comparative indices or categories. Please Also Note: (1) comparative benchmarks/indices may be more or less volatile than your Shadowridge accounts; and, (2) a description of each comparative benchmark/index is available upon request or at www.shadowridgeinvest.com.