

What a difference a few weeks can make. Is the price of oil still relatively high? It sure is. But does the market care? Not from what I can see. While March finished with a pullback in the S&P 500 (SPY ETF) of around -8.88%, once April arrived, it rebounded into new all-time highs.
However, I should note that now, several weeks into this market rally, the strength of many sectors is starting to taper off. Technology (XLK ETF) has remained one of the stronger sectors. Sure, Energy had its day earlier this year, driven by the spike in oil prices related to the Iran conflict. The Energy (XLE ETF) is roughly the same price it was 52 trading days ago (FastTrack data).
The Federal Reserve got a new Chairman, Kevin Warsh, replacing Jerome Powell (who will remain a Fed governor). What we know so far is that his vision is to lower interest rates, shrink the Fed’s balance sheet, and believes AI and crypto will lead the way forward. Lower rates historically tend to support the stock market, so that could be positive if that can be achieved.
However, looking at the 2-year Treasury yield right now, some analysts have argued rates should probably be 0.25% higher than they are today. That agrees with Tom McClellan’s work that suggests the Fed Funds rate would be better off just following the 2-Year yield instead of a team of PhD’s. When you compare the two, he does make a good point.
In my May market update video, I spend some time at the end talking about UPI (Ulcer Performance Index) Scoring and how we are leaning into it more and more to help us evaluate investments through an additional risk-management lens. I’ve always been a fan of data and keeping an eye on factors that take into account and even prioritize drawdown when making comparisons. Is fund A better than fund B? That depends, but using this methodology can help us quantify the stress (thus the “Ulcer”) when the market goes through a rough patch.
This month’s chart is a look at the 2-year Treasury Yield vs. the Fed Funds rate (mentioned above). The yields shown have been sneaking upward over the past few weeks to just over 4.00% while the Fed Rate is at 3.75%. This is what we look at when trying to get an understanding of where the Federal Reserve is likely to be moving rates next. So while the new Fed governor wants to lower rates, this chart suggests the next change should be upwards to match the 2-year yield.
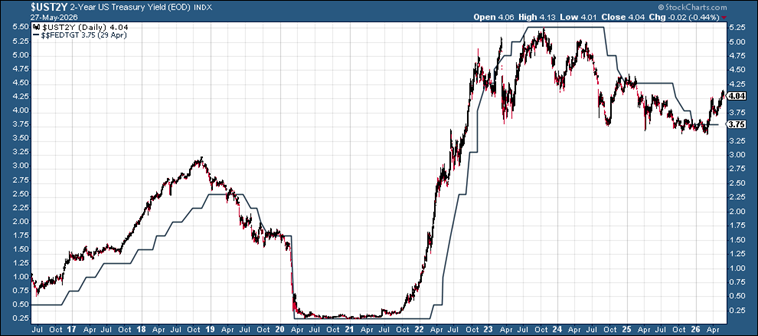
Ten-Year chart of the 2-Year Treasury Yield with the Fed Funds Rate (Source: StockCharts.com)
Our Shadowridge Long-Term Trend indicator has remained positive since April 8th, suggesting the market could continue moving higher. For now, we don’t see any signs of trouble in this data until it breaks below its trendline.
Our Mid-Term Cycle indicator turned positive on May 21st, after an interesting move lower in this data. All while the market continued to grind sideways and even slightly upwards. Even if the market isn’t going down when this indicator is falling, it does tend to suggest short-term headwinds to the market moving higher. But now that has resolved itself, and the positive momentum appears likely to continue.
As of Wednesday night (May 27th, 2026), our Shadowridge Dashboard showed Positive to Negative market sectors as 6 to 5. Technology has been the stand-out leader in the recent rally, while many other sectors have slowed down considerably. For now, the sectors that drive the market higher are still largely on the positive side. This is a 3rd positive metric suggesting positive health of the current market environment.
Right now, 9 RGB Bond Indexes are back to trending positive, all above their 50-day Moving Averages. Bond sectors have been messy this year, with many making frequent trips above and below their trendlines. For now, they look good, but as we’ve said many times in the past, we continue to question whether core bond sectors will provide the same diversification benefits they historically have.
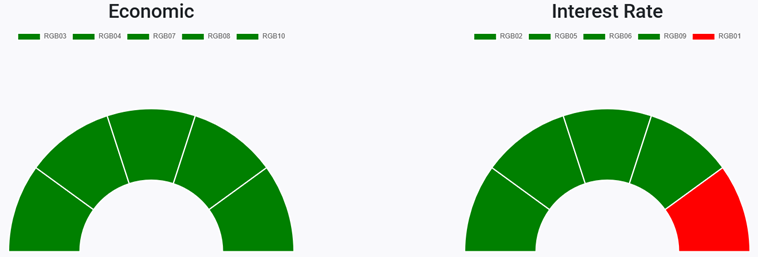
RGB Economic and Interest Rate Sensitive Bond sectors (Source: ShadowridgeData.com)
Traditional Bond sectors continue to offer limited diversification benefits during periods of volatility. The 7-10 year Treasuries (IEF) and the Aggregate Bond Index (AGG) are both close to flat on the year so far. We still find limited benefit in these traditional asset classes. Bond holdings are often the first area we can improve when we are asked to review portfolios managed elsewhere. Too many traditional allocators are still using parts of this asset class that may offer little benefit to overall portfolio resilience in times of market stress.
Bottom Line: Awesome rebound in the market off of the Q1 pullback, but the leadership is shrinking to mostly the Technology sector. The bond market isn’t offering much value in diversification, so we continue to remain selective in those areas. However, several other asset classes like Bank Loans, Arbitrage, and Market Neutral funds have helped us reduce portfolio drawdowns and helped to keep client “ulcers” to a minimum.
Stay safe out there!
Important Disclosure Information
Please remember that past performance is no guarantee of future results. Different types of investments involve varying degrees of risk, and there can be no assurance that the future performance of any specific investment, investment strategy, or product (including the investments and/or investment strategies recommended or undertaken by Shadowridge Asset Management, LLC [“Shadowridge]), or any non-investment related content, made reference to directly or indirectly in this commentary will be profitable, equal any corresponding indicated historical performance level(s), be suitable for your portfolio or individual situation, or prove successful. Due to various factors, including changing market conditions and/or applicable laws, the content may no longer be reflective of current opinions or positions. Moreover, no portion of the foregoing content serves as the receipt of, or a substitute for, personalized investment advice from Shadowridge. Neither Shadowridge’s investment adviser registration status, nor any amount of prior experience or success, should be construed that a certain level of results or satisfaction will be achieved if Shadowridge is engaged, or continues to be engaged, to provide investment advisory services. Shadowridge is neither a law firm, nor a certified public accounting firm, and no portion of the commentary content should be construed as legal or accounting advice. A copy of the Shadowridge’s current written disclosure Brochure and Form CRS discussing our advisory services and fees continues to remain available upon request or at www.shadowridgeinvest.com. Please Remember: If you are a Shadowridge client, please contact Shadowridge, in writing, if there are any changes in your personal/financial situation or investment objectives for the purpose of reviewing/evaluating/revising our previous recommendations and/or services, or if you would like to impose, add, or to modify any reasonable restrictions to our investment advisory services. Unless, and until, you notify us, in writing, to the contrary, we shall continue to provide services as we do currently. Please Also Remember to advise us if you have not been receiving account statements (at least quarterly) from the account custodian.
Historical performance results for investment indices, benchmarks, and/or categories have been provided for general informational/comparison purposes only, and generally do not reflect the deduction of transaction and/or custodial charges, the deduction of an investment management fee, nor the impact of taxes, the incurrence of which would have the effect of decreasing historical performance results. It should not be assumed that your Shadowridge account holdings correspond directly to any comparative indices or categories. Please Also Note: (1) comparative benchmarks/indices may be more or less volatile than your Shadowridge accounts; and, (2) a description of each comparative benchmark/index is available upon request or at www.shadowridgeinvest.com.