
As strong as the broad market was in April and May, it’s not much of a surprise to see it take a break in June. And the month of June even started on a high note, hitting new all-time highs on the 2nd day of the month, only to drift sideways or lower after that.
Historically, July has often been a stronger month for equities before the more seasonally challenging August and September period. Current market conditions share some characteristics with those historical patterns, potentially setting up for a market rally into July.
The bigger news that we would have thought to push the market to new highs was the peace deal with Iran. And while I know it may only be temporary, usually that sort of news can push the market higher for at least a few days, but we didn’t see much of that.
Another notable event this month was the IPO of SpaceX (ticker: SPCX). While the offering generated tremendous buzz, we generally avoid investing in the early days of a newly public stock. History shows that the first year after an IPO is often especially volatile, as it gives early investors (who bought far before the public offering) the chance to sell their already-appreciated shares. Our preferred way to gain exposure is through an index fund or sector ETF that includes SpaceX, but only if it ranks well in our fund screening.
The other news was the Federal Reserve meeting led by new chairman Kevin Warsh. Early expectations were that he’d hint at lower rates, but after he spoke, that tone shifted, and the odds of higher rates later in the year increased. In addition, there could be changes in how the Fed reports data – including the famous “dot plot” and data used. Warsh mentioned leaning into more real-time and/or alternative data. This could be interesting.
This month’s chart is a look at New Lows on the NYSE. A version of this is shown each month in my live webinar. It tells us, day-by-day, how many stocks on the NYSE are hitting new lows. If the value generally stays above the red 100 line, that may suggest there isn’t much fear in the market. We find this especially useful when the market is in decline or just drifting lower, yet the new low count is still holding above the 100 level. If we want to get a sense of whether the fear in the market is real or not, this is one of the indicators we monitor closely.
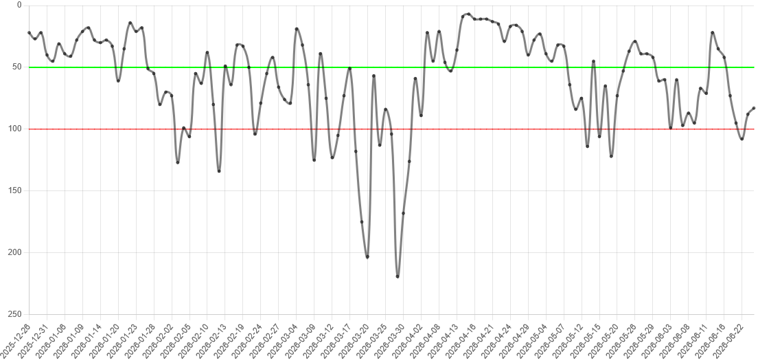
Six-month chart of NYSE New Lows with price levels at 50 and 100 (Source: ShadowridgeData.com)
Our Shadowridge Long-Term Trend indicator has remained positive since April 8th, suggesting the market could continue moving higher. Even with the market drifting lower in June, this indicator did not indicate a need to get defensive.
Our Mid-Term Cycle indicator is as neutral as it can be. Not showing strength or weakness worth following. If seasonal trends continue to play out, then this is one of the first places we’ll see a heads-up signal. So we’ll be watching.
As of Wednesday night (June 24th, 2026), our Shadowridge Dashboard showed Positive to Negative market sectors as 5 to 6. Financials are now the stand-out positive sector, while Energy and Communication are the relative laggards.
Right now, 9 RGB Bond Indexes are back to trending positive, all above their 50-day Moving Averages. Interesting to note that the one weak bond sector shifted this month from US Treasuries (last month) to Inflation Protection Bonds (this month). That feels a bit Fed-driven for now and is something to keep in mind going into the summer.
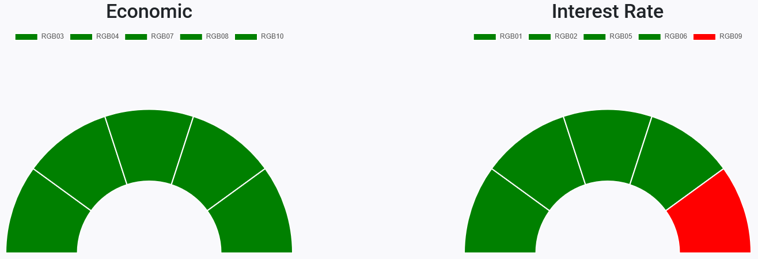
RGB Economic and Interest Rate Sensitive Bond sectors (Source: ShadowridgeData.com)
Traditional Bond sectors continue to offer limited diversification benefits during periods of volatility. The 7-10 year Treasuries (IEF) and the Aggregate Bond Index (AGG) are both flat or just under 1% on the year. We still find limited benefit in these traditional asset classes. This remains one of the easiest portfolio fixes we see when reviewing how people are generally allocated. It may be a little bit outside the box, but we’ve found this approach may be helpful in certain market environments (like now).
Bottom Line: After a strong April and May, we had a very “meh” June. But historical seasonal patterns suggest we could be setting up for a strong July. The broad bond market is (again) offering no benefit to diversification, so we continue to be selective within fixed income rather than relying primarily on traditional core bond sectors. There hasn’t been enough of a reason to get defensive, so we haven’t made many changes in the past month. For now, we remain optimistic on the rest of 2026 until the data proves to us otherwise.
Stay safe out there!

Shadowridge Asset Management, LLC is a registered investment adviser. Advisory services are only offered to clients or prospective clients where Shadowridge and its representatives are properly licensed or exempt from licensure. This content is for informational purposes only and should not be construed as personalized investment, tax, or legal advice. Investing involves risk, including the possible loss of principal. Past performance is not indicative of future results.
1 The Standard and Poor’s 500 is an unmanaged, capitalization-weighted benchmark that tracks broad-based changes in the U.S. stock market. This index of 500 common stocks is comprised of 400 industrial, 20 transportation, 40 utility, and 40 financial companies representing major U.S. industry sectors. The index is calculated on a total return basis with dividends reinvested and is not available for direct investment.
2 Charts are for informational purposes only and are not intended to be a projection or prediction of current or future performance of any specific product. All financial products have an element of risk and may experience loss. Past performance is not indicative of future results.