
The stock market has been on quite a ride since the end of last month. Many major indexes appeared to have bottomed just before March ended, kicking off a surprisingly strong rally that brought new highs to several of these indexes. I had mentioned last month that one of the biggest risks we saw was for a dramatic reversal off the lows due to a “rapid shift in sentiment.” That is exactly what we got.
The pullback’s bottom in March concluded a 43-day drawdown in the S&P 500 that only moved -8.9% from a late January peak. However, the NASDAQ 100 had a different story. It peaked in late October and had an almost -12% drawdown over a much longer 103 trading days.
As we mentioned last month, the price of Oil has been a key factor in how the stock market has moved recently. Of course, the Iran conflict is a factor, but even without that, the price of oil could slow the world economy if it stays too high for too long. But just as April started, the price of oil peaked and somewhat rapidly reversed course. Now it is at a price level that is much more reasonable for the world to keep moving. This remains a key factor in where the market goes next, so it is something we’re watching closely.
On my monthly webinar/video market commentary, I like to reference various Seasonality cycles. And we are still in the 2nd year of the 4-year presidential cycle, which tends to be a tough year with increased volatility. There can still be bright spots, but this cycle is a time to be quicker to protect investments if the data supports it. So far, however, we really haven’t seen much negativity.
This month’s chart is a look at the S&P 500 (SPY ETF) with the Money Flow Index (MFI). When the MFI reading goes above 80, it tends to be at or near the end of a run up. We find it’s a good time to take a look at profits made and consider trimming back. Or for investors who are living off their investment income, this is one of those times where it can make sense to re-fill the distribution bucket. This helps us refill that income bucket when things are good and the market is high, and this signal doesn’t happen very often. Over the past year, there have only been 3 times where MFI crossed above the 80 level.
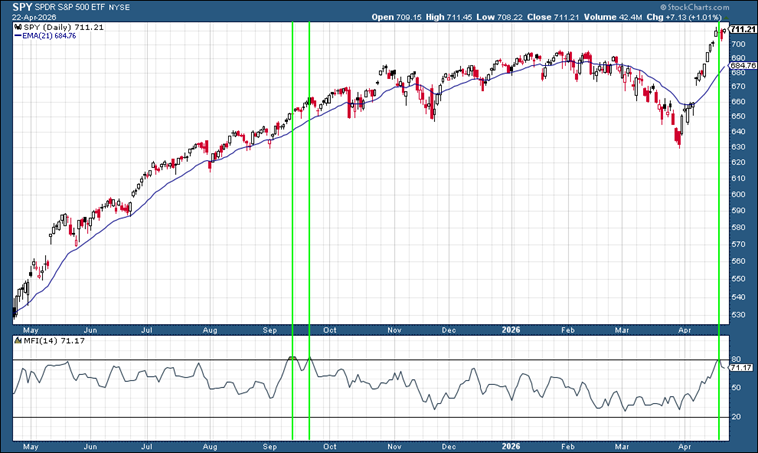
One-Year chart of the S&P 500 (SPY ETF) with MFI Indicator below (Source: StockCharts.com)
Our Shadowridge Long-Term Trend indicator turned positive again on April 8th, suggesting that the market could continue moving higher. This data tends to stay positive for a while when it turns, so the recent volatility may be behind us for now (barring any unexpected news).
Our Mid-Term Cycle indicator turned positive on April 2nd and has had an outsized move upward. However, it now suggests the run-up has slowed down a bit. For now, it remains positive, but as they say, the easy money has been made. Now we watch and wait to see what’s next.
As of Wednesday night (April 22nd, 2026), our Shadowridge Dashboard showed Positive to Negative market sectors as 7 to 4. The sectors on the negative side are largely defensive areas, like Healthcare, Utilities, and Consumer Staples. For now, that’s a sign that the growth-oriented sectors are back to leading the market.
Right now, all 10 RGB Bond Indexes are back to trending positive, all above their 50-day Moving Averages. Bond sectors across the board weren’t much help during the sell-off we saw in March, suggesting that correlations remain high and not giving us much reason to use them for diversifiers.
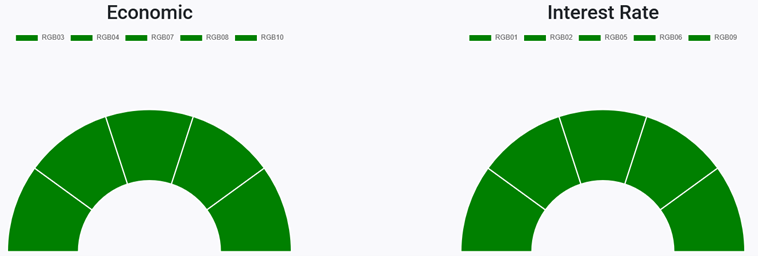
RGB Economic and Interest Rate Sensitive Bond sectors (Source: ShadowridgeData.com)
Traditional Bond sectors have recently offered limited diversification benefits during periods of volatility. The 7–10-year Treasuries (IEF) and the Aggregate Bond Index (AGG) didn’t do much to help offset portfolio risk by owning them in March. However, many short-term and ultra-short-term bond sectors held their ground and even made progress while the market had its pullback. We continue to believe that the entire point of having bonds in a portfolio is to reduce risk, so our picks in this area tend to be outside the box of what we see as traditionally offered.
Bottom Line: We’ve seen a solid rebound and recovery of many market indexes following a long-ish and slow grind downward. But it never looked bad enough to have to take anything more than some basic defensive measures. And we’ve participated in the recent recovery. While the data suggests the Iran and oil issues may have stabilized, there is still the possibility of headline risk or some news event (that tends to happen over the weekend when we can’t do much about it) that moves the market in unexpected ways. For now, we remain optimistic, but at the ready if data suggests getting defensive.
Stay safe out there!

Shadowridge Asset Management, LLC is a registered investment adviser. Advisory services are only offered to clients or prospective clients where Shadowridge and its representatives are properly licensed or exempt from licensure. This content is for informational purposes only and should not be construed as personalized investment, tax, or legal advice. Investing involves risk, including the possible loss of principal. Past performance is not indicative of future results.
1 The Standard and Poor’s 500 is an unmanaged, capitalization-weighted benchmark that tracks broad-based changes in the U.S. stock market. This index of 500 common stocks is comprised of 400 industrial, 20 transportation, 40 utility, and 40 financial companies representing major U.S. industry sectors. The index is calculated on a total return basis with dividends reinvested and is not available for direct investment.
2 Charts are for informational purposes only and are not intended to be a projection or prediction of current or future performance of any specific product. All financial products have an element of risk and may experience loss. Past performance is not indicative of future results.