
Heading into the new year, and the 2nd year of the 4-year presidential cycle, I would have expected to see a little more volatility, especially towards the end of the month. But so far, it’s been relatively calm. The S&P 500 had a mid-month pullback of about -2.5% then slowly gained it back into the end of the month.
The Small Cap index is being talked about quite a bit, but it peaked mid-month and is now drifting lower. I’ve often said that I have “trust issues” with this index. While it can have large moves, they can also turn against you very quickly. There are usually easier ways to make money than to fight this battle.
The Federal Reserve held rates stayed in the 3.5 – 3.75% range after three quarter-point cuts in late 2025. The Fed noted solid economic expansion and relatively stable unemployment data for their reason to pause rate cuts for now. Looking at the FedWatch tool right now, it appears there is little likelihood of a rate cut at either the March or April meetings. But we know that can change abruptly if the economic environment changes.
The stock market is still somewhat overvalued, but that doesn’t mean it will stop going up just yet. And while I’m not as “bullish” on 2026 as many others out there, I’d agree that there isn’t much to be concerned with in the immediate future. There are indeed small cracks to the foundation driving prices upward, but what eventually happens to break it is still unknown.
This month’s chart is a look at the ratio between Large Cap Growth (IVW) and Large Cap Value (IVE). When the ratio is moving upward, that means growth is stronger than value. When you compare that to the broad index below, the S&P 500 tends to rise much more easily when Growth is leading Value. And when Value is leading Growth (look at the 2022 bear market) volatility tends to be higher and the chance of an extended market correction is also higher. That doesn’t mean it has to happen, it is just what the odds favor in that scenario. So currently Value is leading Growth since mid-October, and the overall market hasn’t been as strong as it was from May to September 2025.
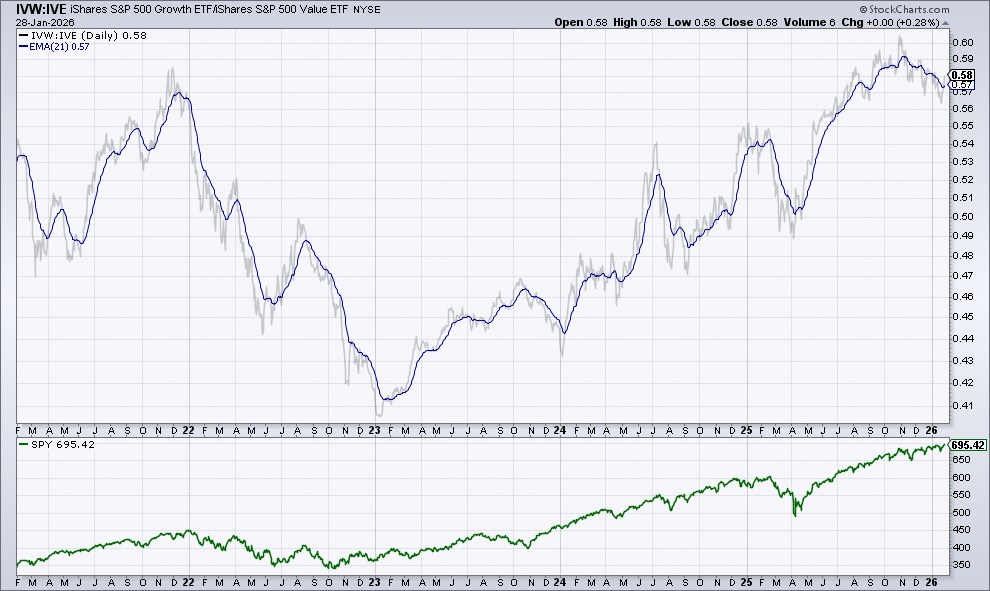
Five-year chart of the IVW-IVE ETF Ratio (Growth-Value) over the S&P 500 (SPY ETF) (Source: StockCharts.com)
Our Shadowridge Long-Term Trend indicator remained positive for the entire month of January with little signs of slowing down. With this trend in-tact, there is little reason to be concerned about the market at the moment.
Our Mid-Term Cycle indicator is also positive, but has been slowly weakening since mid-January. So while the data is positive, it is also uninspiring. If it turns negative, that could give us an opening to invest new funds or even nudge our allocations slightly more aggressive.
As of Wednesday night (January 28th, 2026), our Shadowridge Dashboard showed Positive to Negative market sectors as 3 to 8. The sectors that make up the S&P 500 aren’t showing a rosy picture either. Only Communications, Industrials, and Consumer Staples are positive. I’d like to see Tech and Financials make the shift to the positive column to convince me to be more aggressive. For now, we wait.
Right now, all 10 RGB Bond Indexes are trending positive, above their 50-day Moving Averages. Strength continues to lean toward the Economically sensitive bond sectors. Exactly the same as last month.
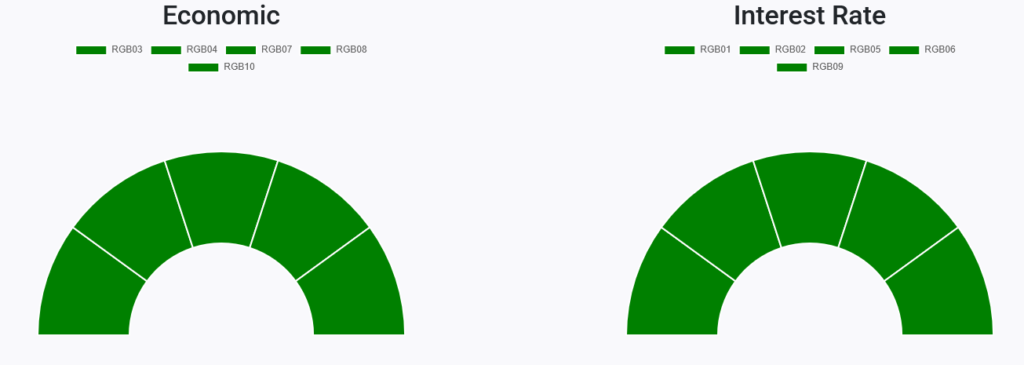
RGB Economic and Interest Rate Sensitive Bond sectors (Source: ShadowridgeData.com)
Traditional Bond sectors aren’t making much progress. While showing some unexpected strength for the year overall, the Aggregate Bond Index (AGG ETF) hasn’t made any progress in the last 3 months. As I said above, the Economic bond side is where we’re seeing strength, largely in Floating Rate, High Yield, and Emerging Market bonds. As always, our allocations lean into strength, so those last 3 areas are where we’re focused.
Bottom Line: There isn’t much to be concerned about in the market in the short-term, but there are factors that could eventually cause some bigger issues. But first we’d need a larger catalyst, and we’re just not seeing that yet. On the plus side – broad stock market indexes are still touching new highs and buy-the-dip thinking is still in play. The bull case still holds for now.
Stay safe out there!

1 The Standard and Poor’s 500 is an unmanaged, capitalization-weighted benchmark that tracks broad-based changes in the U.S. stock market. This index of 500 common stocks is comprised of 400 industrial, 20 transportation, 40 utility, and 40 financial companies representing major U.S. industry sectors. The index is calculated on a total return basis with dividends reinvested and is not available for direct investment.
2 Charts are for informational purposes only and are not intended to be a projection or prediction of current or future performance of any specific product. All financial products have an element of risk and may experience loss. Past performance is not indicative of future results.