
I don’t normally make or even follow predictions because doing so anchors one’s mind to that expectation. If the stock market goes in a different direction than what was predicted, there can be a strong psychological pull on me to make wrong decisions. With that said, I’m going to go out on a limb and talk about making a prediction, anyway.
We’ve been in a bear market since last year, so predicting the start of that doesn’t count. What I want to do right now is show you how we can know when this bear market will end. Since bear market bottoms often present the best investing opportunities, this should be of interest to all of us.
The data I will use in this prediction is what is called an Interest Rate Spread. The term “interest rate spread” refers to the difference in two different interest rates.
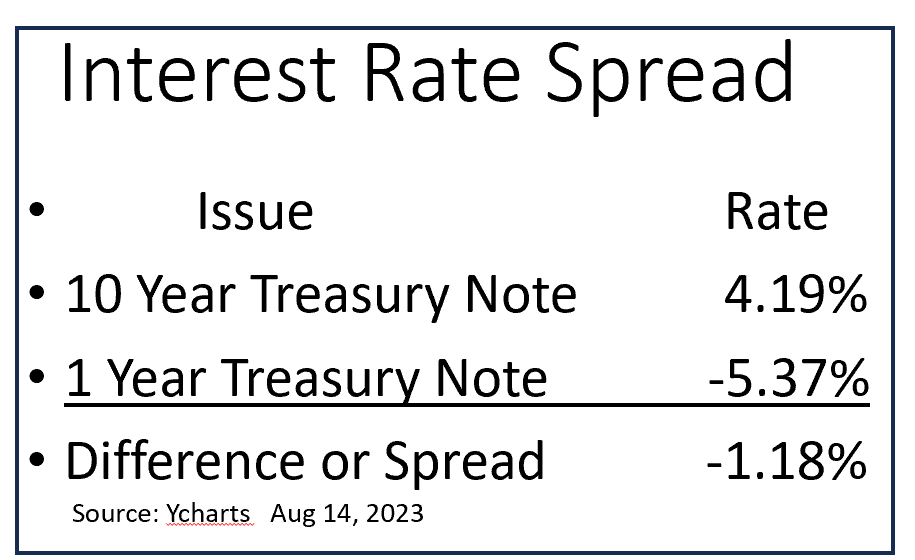
Today we will talk about the spread between the 10 Year Treasury Note and the 1 Year Treasury Note because subtracting short-term rates from long-term rates can give us an insight into the economy and the stock market direction.
The keys to this analysis are which rate is higher, how far apart the two rates are, and are they moving closer together or is the spread widening? This particular spread is an accurate predictor of recessions, and this is why we are focusing on it.
In healthy economies, long-term rates are higher than short-term rates. But not these days. Since early last year, the 10-year rate has been lower than the 1-year rate, giving a negative remainder when the spread is calculated. This is a condition called “inverted interest rates.”
This next chart shows the history of this spread from the 1960s to present. Most of the time the economy is healthy, the spread is positive, and the blue line, which shows the spread, is above the red zero line. On the right edge of this chart, we can see that rates have inverted and the spread dropped below zero last year.
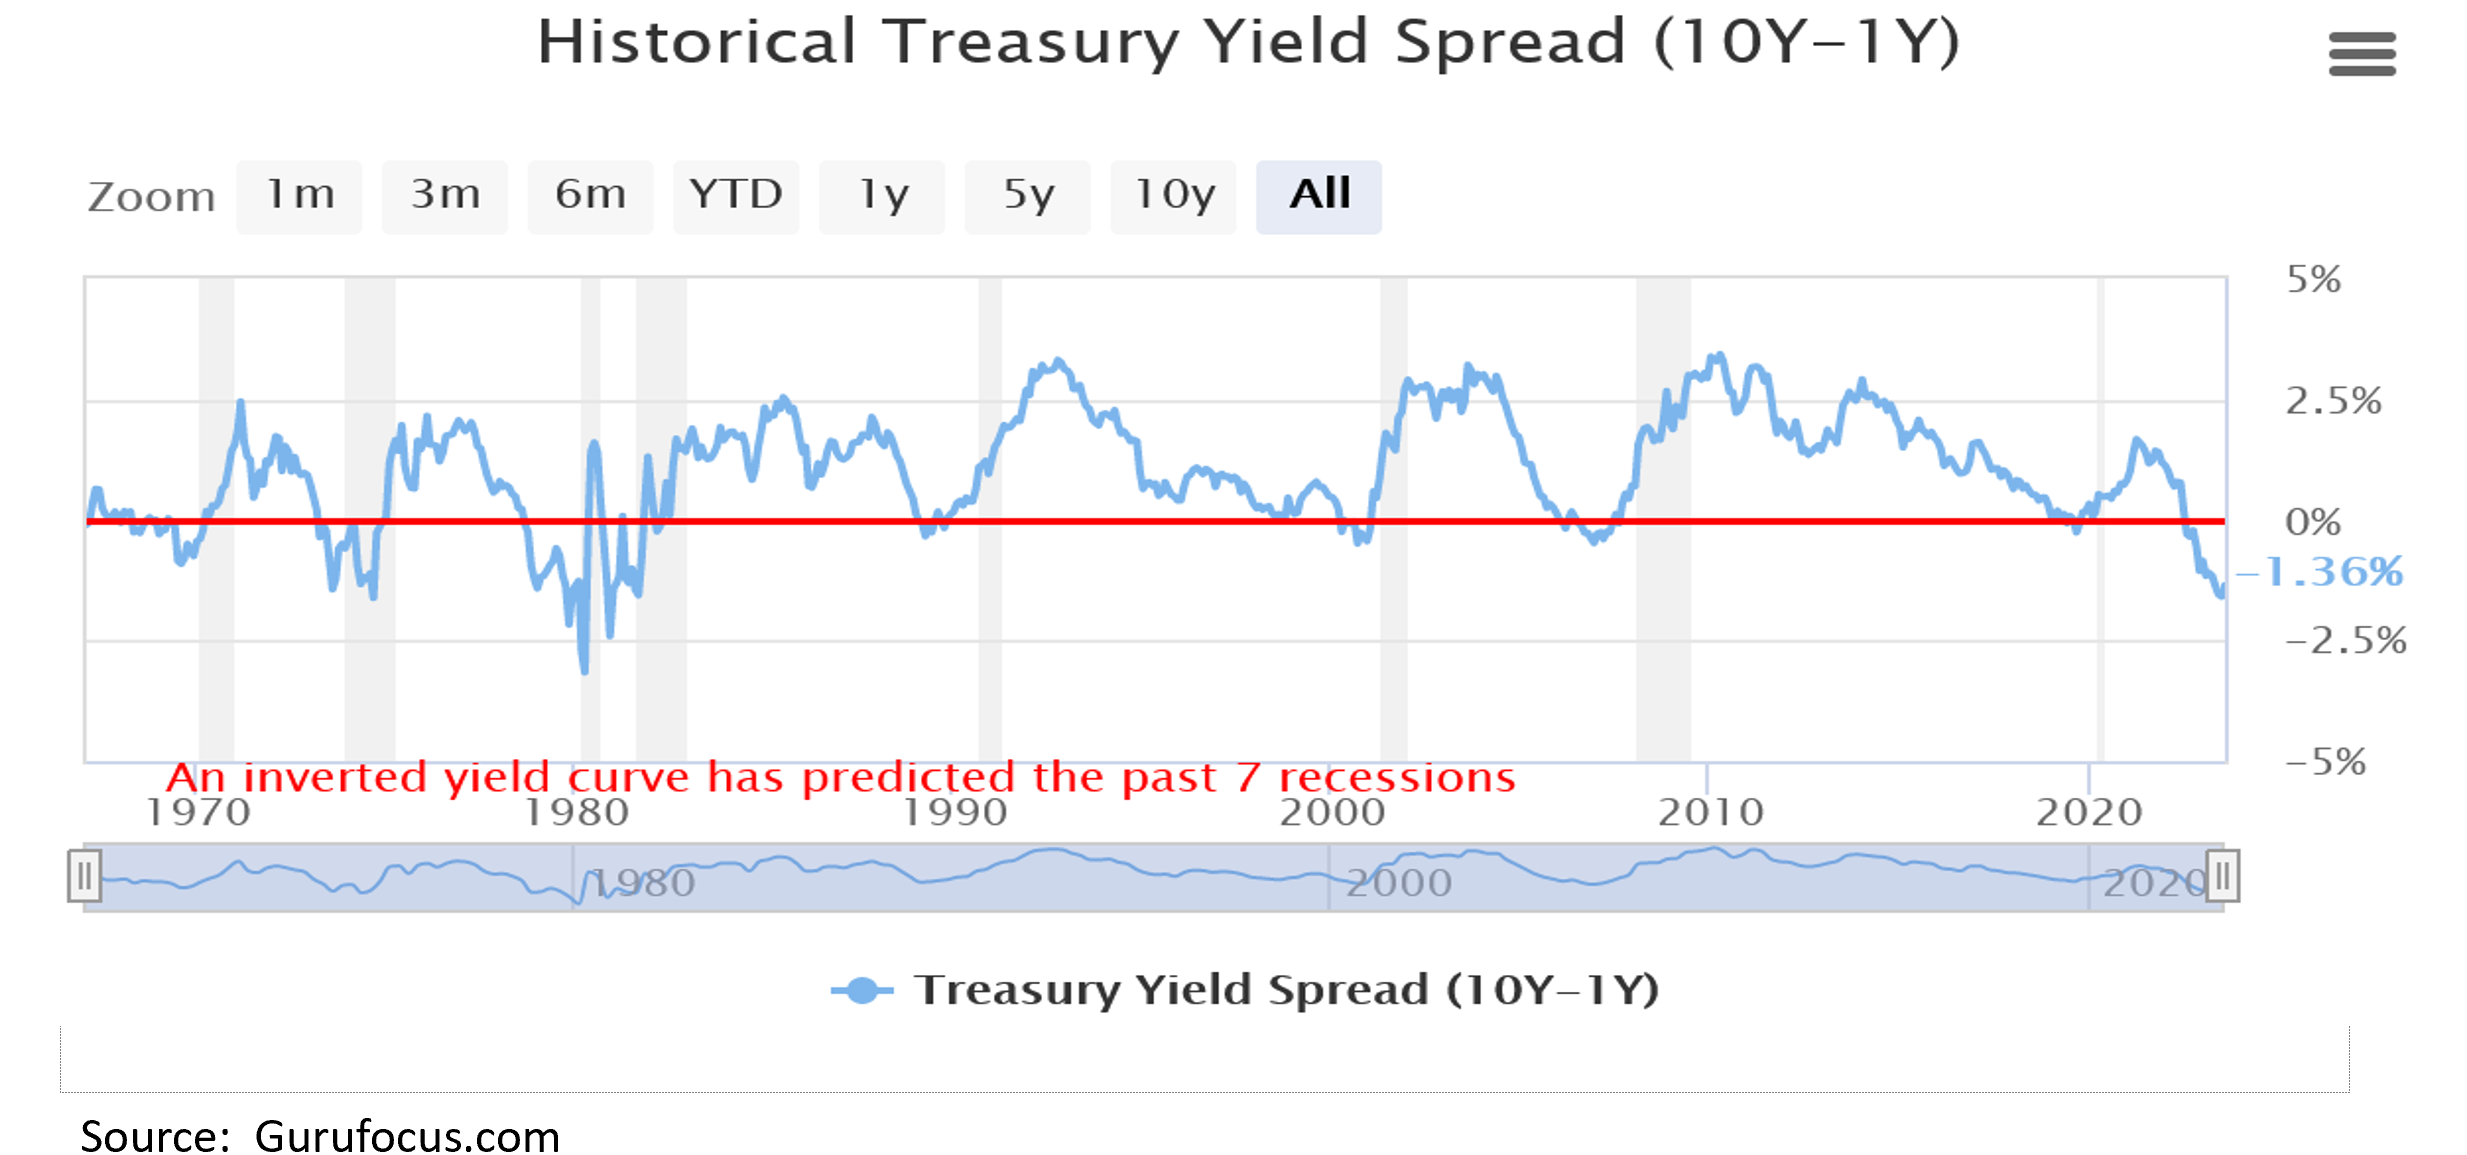
The 7 most recent economic recessions are highlighted in grey on the chart. Each of the 7 recessions was preceded by the spreads becoming inverted and crossing the red line, even if only for a brief time. Statistically, 7 is not a huge sample size, but 7 out of 7 is a 100% record. A perfect prediction record in this industry is really rare, so when we see one, we pay attention.
A year has passed since the inversion in rates, so why have we not seen a nationwide recession yet as this rate inversion predicted? Some industries have been in recession, just not the whole economy. Housing suffered as the Fed began raising interest rates 20 months ago. The LA Times reports that home sales are 19% below a year ago. Factory production is also down, just not as badly as real estate. Tech and finance have both seen large layoffs as well. So, some industries are clearly in recession.
However, some industries beaten down during Covid lockdowns, such as travel, hospitality, and restaurants have rebounded strongly, masking the underlying weakness in the rest of the economy.
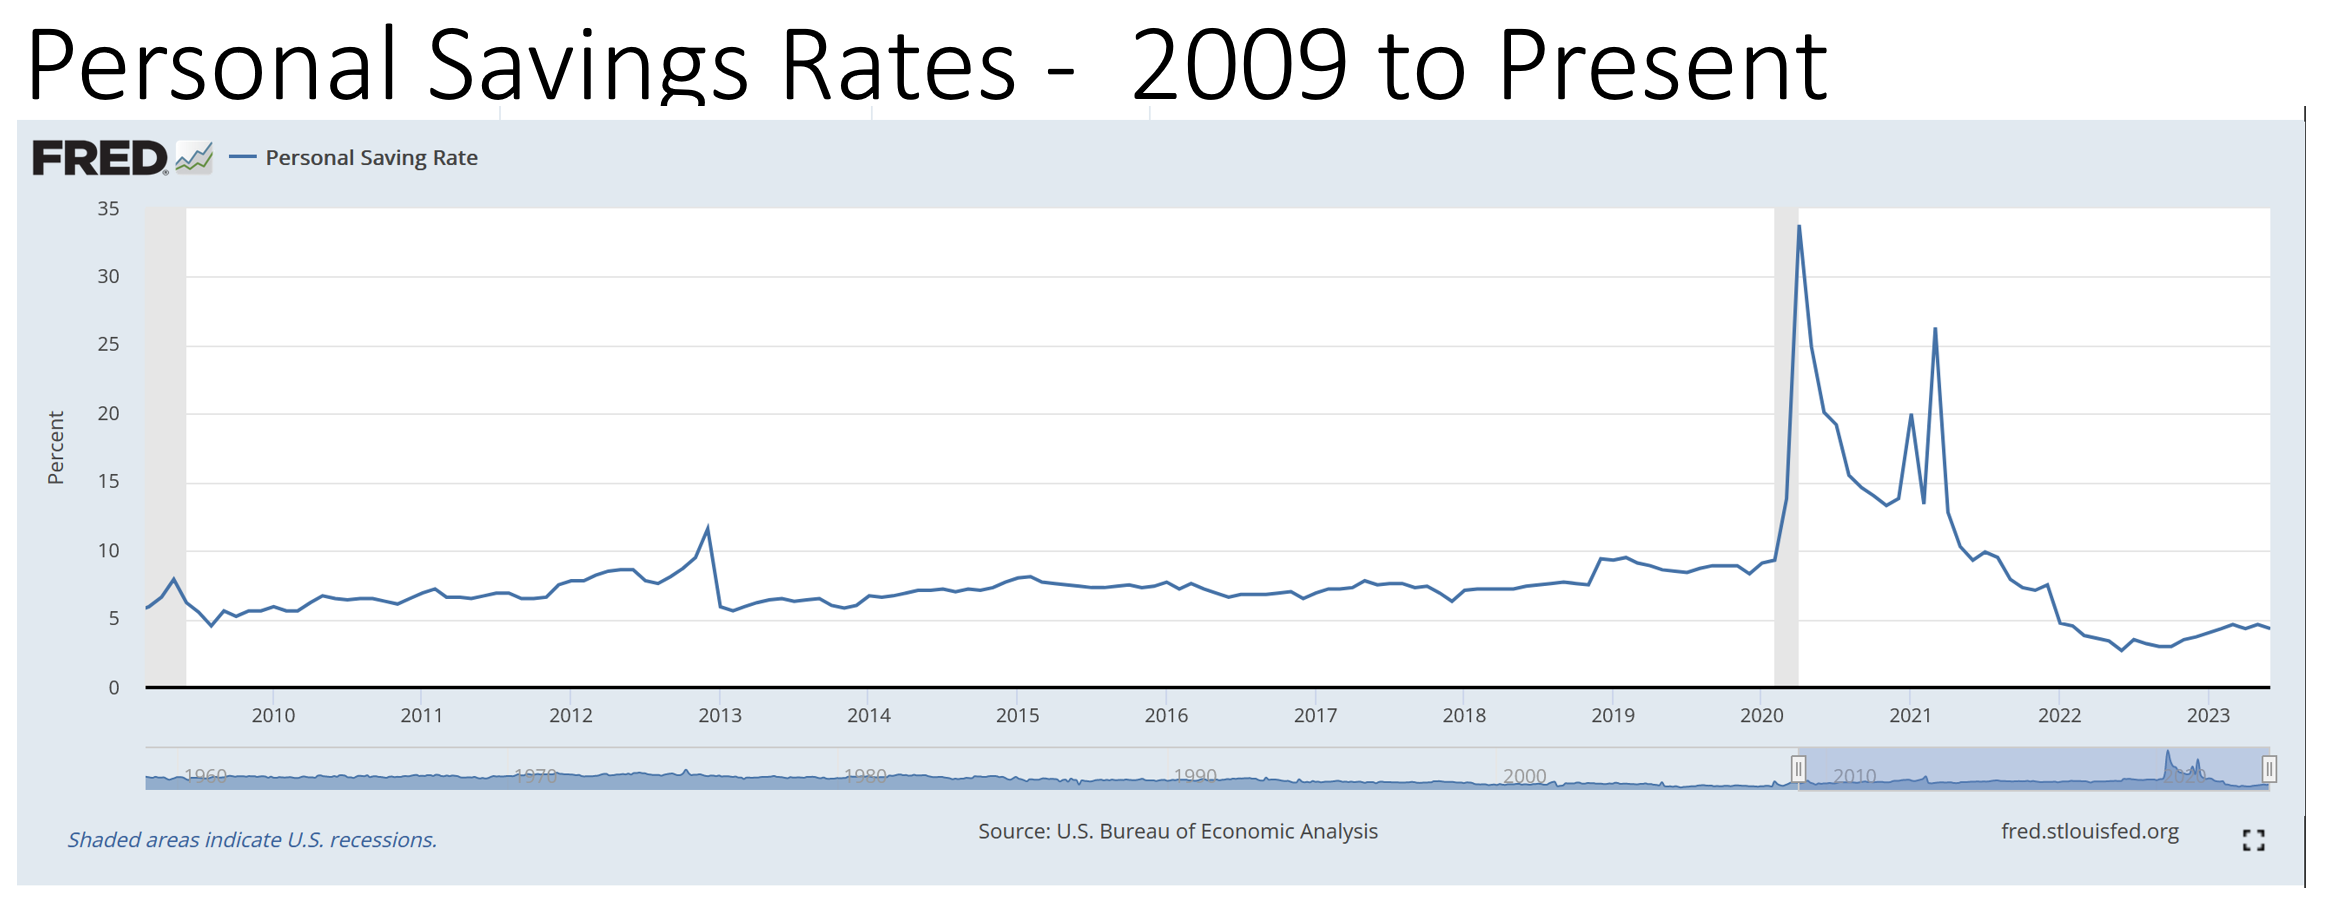
I’ve heard the term “Richcession” used, meaning that more affluent people can continue to spend on travel, retail, and restaurants, while the less affluent have to cut back. However, data on this chart from the Federal Reserve show that savings levels have dropped sharply over the past few years, so even the “Richcession” may be in the process of running out of gas.
One thing to note on the Interest Rate Spread chart is that there is almost always a delay from the time the interest rates invert to the declared beginning of a recession. The government is the official declarer of recessions, and their formula requires at least two quarters of Gross Domestic Product shrinkage before they formally announce a recession. That would account for a good part of the lag.
But as investment managers, this time lag also gives us a good heads-up on where the stock markets are going.
My friend Tom McClellan runs a newsletter company called McClellan Financial Publications (mcoscillator.com) and Tom is one of the best visual traders I have ever encountered. He recently posted a piece that looked at the interest rate spread and what that can tell us about the end of the bear market.
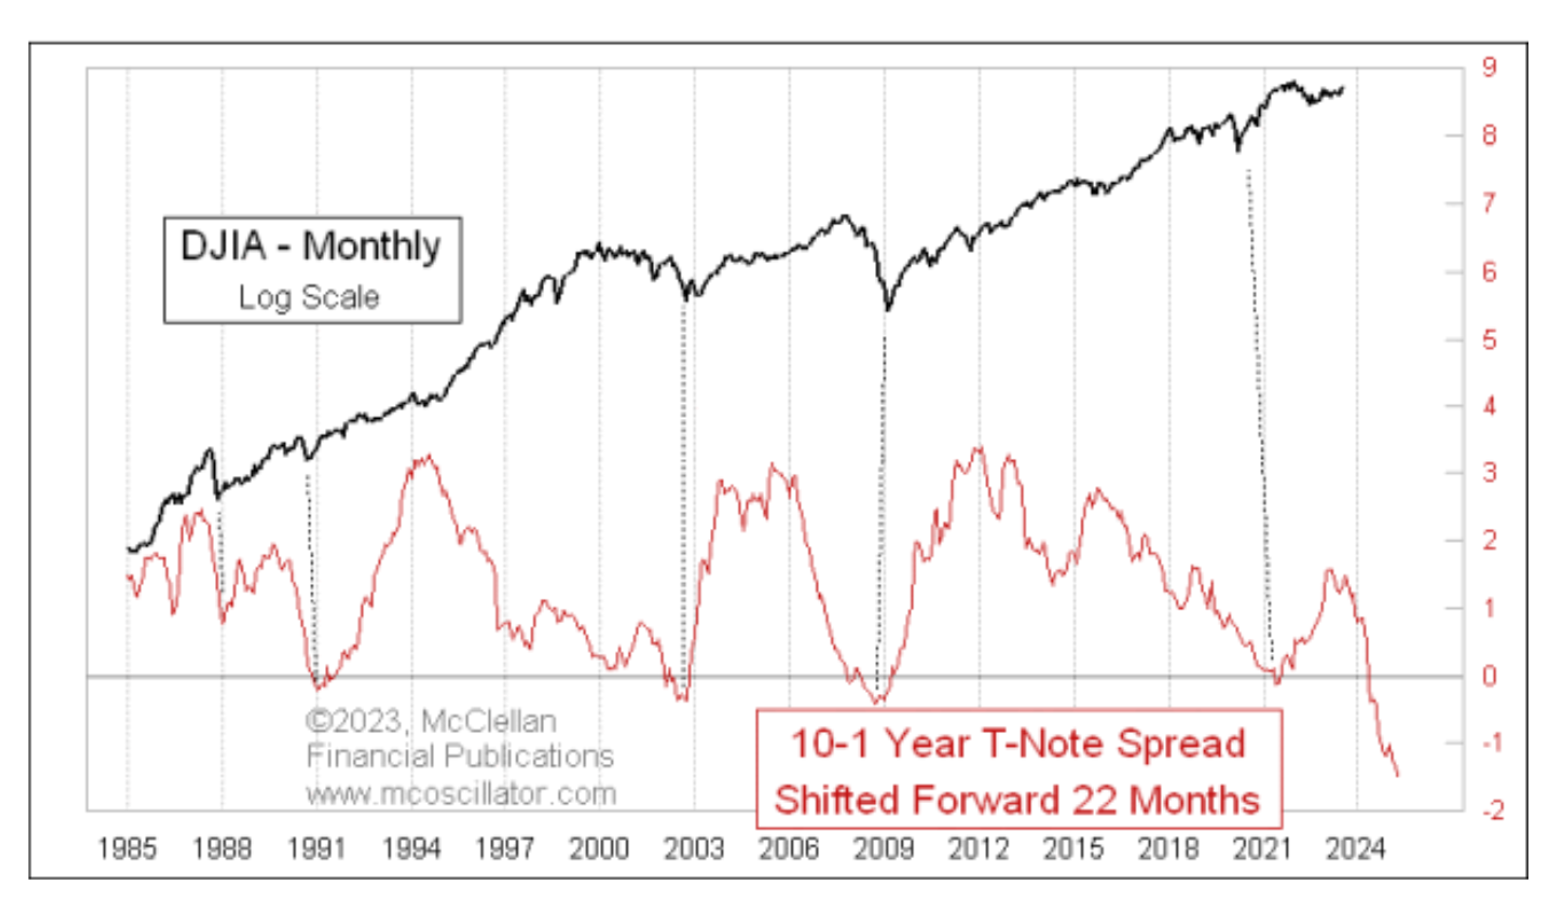
Most interest rate inversions tend to be short lived and bear markets end, on average, around 22 months after interest rate inversions reverse and begin to correct themselves.
We can see this in McClellan’s chart which shows how the bottoms in the interest rate spread, when shifted forward 22 months, line up very closely with bottoms in the stock market, in this case, the Dow Jones Industrial Average.
When the current inversion eventually reverses, the date axis at the bottom of the chart will tell us when the stock markets are likely to bottom.
A year ago, when rates first inverted, many of us hoped that we would see the bottom of the bear market and a stock market recovery in about 22 months, which suggested a bull market beginning sometime in early 2024.
However, that 22-month average lag time really begins not when rates first invert, but when the inversion begins to correct itself and spreads begin to get narrower. This makes the length and depth of this inversion significant.
As of this writing in mid-August, the interest rate inversion has not yet bottomed. It is continuing to get deeper, postponing its projected end date. The moment of greatest inversion is the time to count forward from, and we have not yet seen that condition. If interest rate spreads were to begin to contract today, the 22-month average timeframe would suggest that the next bull market will not begin until mid-2025.
So, if you look at your Shadowridge accounts and still see a significant cash component rather than a fully invested position, this is one reason why. Despite the stock market’s strength earlier this year, interest rate spreads suggest strongly that this bear market has not yet ended, and there will be at least one more leg down in the stock markets.
For this reason, we are maintaining a conservative stance in the market while doing what we can do make some gains in what we see as a high-risk environment.
As you can see from the articles in this newsletter, your Shadowridge advisers are not ordinary brokers who read someone’s summary off their computer and then try to sell you stuff. We are true investment analysts and hands-on money managers.
If you like Shadowridge’s service and value, please tell your friends about us. The easiest way to introduce us is to simply forward our newsletters to them, or send them to our YouTube channel to see our video presentations. They will thank you for it!
