
The major US stock indexes appear to be finding some stability, even if it is just in the short term. For context: as of October 26th, the S&P 500 is down -18.65% year to date, after being down -24.50% at its low point on October 12th. The NASDAQ100 is now down -29.80% after being down -34.77% at its low point on October 14th (FastTrack Data).
But since those mid-October lows, there seems to be a little more stability and less volatility in the movement. On our monthly market commentary webinar earlier this month, I showed two paths that the markets could take. On one hand, they could continue to trend down as they did in 2008. On the other hand, they could follow a more seasonal pattern of finding a bottom and rising into the end of the year. Personally, I don’t expect to see positive numbers by Christmas, but there is still plenty of room for improvement and that would be a welcome sight after the past year.
We are less optimistic about the bond market. While the Aggregate Bond Index hit a low a few days ago, its recovery isn’t what it needs to be. While the Fed continues to aggressively increase interest rates, the bond market is likely to continue hurting for some time. That’s because the value of bonds goes down as interest rates rise. We don’t expect bonds to bottom, at least not in a meaningful way, until the Fed stops raising rates. But that might still be a while.
The Dollar has fallen off a cliff lately, and that (as I mentioned last month) could be the catalyst for a move up into the end of the year. If so, that move up could have a positive effect on all areas: Stocks, Bonds, Commodities, Crypto, etc.
Our Shadowridge Long-Term Trend is still negative for now, but showing signs of improvement. Our Mid-Term Cycle signal is now positive and showing stronger numbers than we’ve seen in a while. We said last month that we’d be watching for a potential bottom in October, and we might be seeing that now. That has us nudging stock market exposure back into our models this week.
As of Wednesday night (October 26th, 2022), our Shadowridge Dashboard showed Positive to Negative sectors as 8 to 3. Energy and Healthcare remain the leaders from last month, with Financials and Industrials also showing strength. The weakness still lies in Real Estate and Utilities. It is odd to see the sectors that are usually used for “safety” getting hit the hardest over the past month. To us, it just shows how traditional thinking may be flawed in times like these.
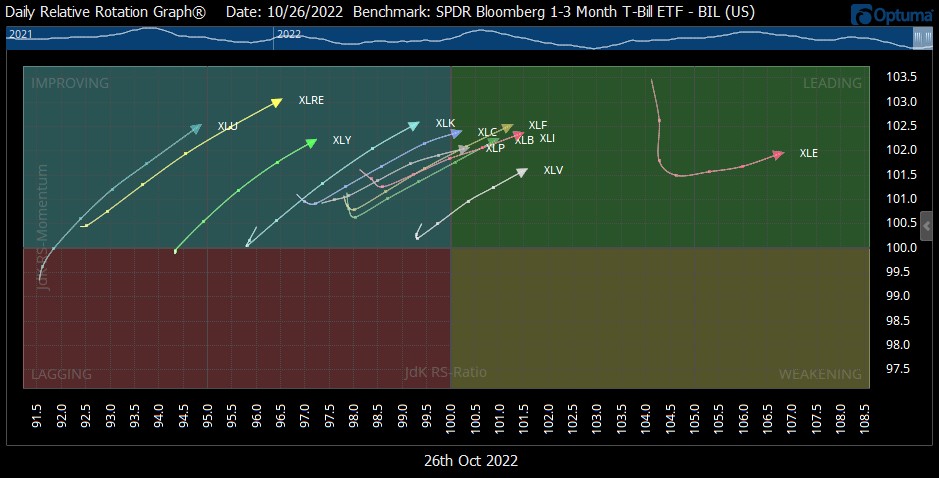
For this month’s chart, let’s look at the Daily Relative Rotation Graph (RRG) of the 11 Sectors of the S&P 500 vs. T-Bills. I frequently share a variation of this chart on our webinars and on Twitter. What I like about this graph is that it shows where each sector is heading relative to T-Bills (often referred to as the “Risk-Free Rate”). When the lines are moving up and to the right (into the Blue “Improving” and Green “Leading” boxes), that suggests strength is coming back into the overall market. Especially when all 11 are participating. You can even see how Utilities (XLU) and Real Estate (XLRE) are lagging behind the rest of the group, as I mentioned above. When this group starts to turn down into the Orange and Red boxes, then we’ll expect to see weakness in the larger indexes.
Bonds – as of this writing, the Aggregate Bond Index AGG is down -15.41% YTD in 2022. The 7–10-year Treasury bond index is -16.66% this year (FastTrack Data). Both numbers are even worse now than they were last month. As I mentioned above, the strength isn’t coming back into the bond market and we are seeing that do the most damage to traditional “60/40” (stocks to bonds ratio) portfolios. Investors with this type of allocation have suffered more than expected in this market. The “traditional” retirement portfolio mix has seen greater losses this year than it has in decades. Thankfully that’s not the case for our clients.
Bottom Line: If the S&P 500 continues to rebound, the Bond index might have a worse year than stocks, and that would be especially difficult for those in retirement using a traditional allocation. Those types of investors may have to take lower distributions in the future. Add to that an era of high inflation, and that could do some real damage to a retirement lifestyle. Luckily, that is not something we expect our clients will have to deal with. So far, we’ve largely been able to avoid this messy year, especially once we got past Q1, so we believe we are in good shape to catch a rebound and keep our clients in retirement at the level they are used to. That’s our goal.
As always, thanks for reading and stay safe out there!!

1 The Standard and Poor’s 500 is an unmanaged, capitalization-weighted benchmark that tracks broad-based changes in the U.S. stock market. This index of 500 common stocks is comprised of 400 industrial, 20 transportation, 40 utility, and 40 financial companies representing major U.S. industry sectors. The index is calculated on a total return basis with dividends reinvested and is not available for direct investment.
2 Charts are for informational purposes only and are not intended to be a projection or prediction of current or future performance of any specific product. All financial products have an element of risk and may experience loss. Past performance is not indicative of future results.