
A historically weak week in the S&P500 was again historically weak. It wasn’t much of a surprise to see the major stock markets in both the US and globally have a tough time in September. Last month we suggested the positive movement in July was likely a “Bear Market Rally” and that seems to be the case.
What is most impressive is how drastically the bond market is selling off. Compared to stocks, this is supposed to be the “safe” money in investor portfolios, but bonds are not acting as they should. We’ve talked in the past about how when interest rates rise, bond prices fall. This is bad news for anyone heavily invested in bonds. If the interest rate environment keeps rising at this pace, there could be a lot more pain ahead in the bond market. “Cash is King” looks to be the winning wisdom of the day.
I don’t normally talk about the currency markets, but right now I find it interesting that the US Dollar is excessively strong against most other world currencies. The Yen, Euro, and the Pound are all having a really tough time out there. And that is also likely a key factor to why both the stock and bond markets are going down. If the Dollar does start to fall (or maybe even just stabilize), then we could be set for a good rally either into the end of the year or sometime early 2023.
Opportunity ahead? With every market sell-off or bear market comes an eventual rebound, which can be significant. Several market bottoms have occurred in October, so it is entirely possible this bear market could end in the next few weeks. Or maybe we get another rally into the end of the year.
However, it is now highly unlikely that the S&P or the US Bond markets will end the year positive – the question is, how bad can it get, or how much can it recover in a short period of time? That is what we are watching the most closely – is there an opportunity to get some money back in? Or do we play it safe for the rest of the year, as was required in 2008 (see this month’s chart below)?
Our Shadowridge Long-Term Trend is showing a strong negative signal at the moment, and our Mid-Term Cycle signal has pushed into extreme negative territory. We’ve remained in low-risk or equity-hedged holdings to keep volatility as low as we reasonably can in this environment. As we move into October, we’re keeping in mind that major bottoms can occur around this part of the year. So we are optimistically looking out for that scenario.
As of Wednesday night (September 28th, 2022), our Shadowridge Dashboard showed Positive to Negative sectors as 0 to 11. This is an extreme over-sold condition, and we could start to do some buying back in the market if the positive number starts to rise. We do, however, hold Healthcare. Right now, that is the strongest sector by the RSI (Relative Strength Index). We had hoped to see more positivity out of the Energy sector, but it’s having a tough time with everything else.
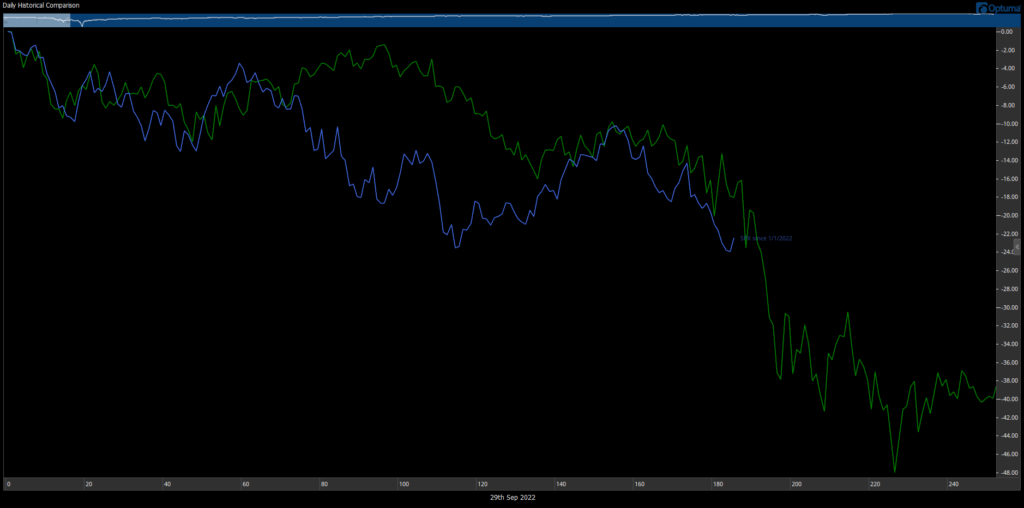
For this month’s chart, we are comparing charts of the S&P 500 YTD in blue and 2008 in green. It’s hard to believe that this year has largely been worse than the legendary bad year of 2008, but here we are. What happens next is the big question. Do we follow that green line to new lows? Or does seasonality kick in and we get a bottom in October (which is more the “usual” course of things)? Time will tell, as always.
Bonds – as of this writing, the Aggregate Bond Index AGG is down -13.72% YTD in 2022. The 7–10-year Treasury bond index is -15.03% this year (FastTrack Data). We are now looking at one of the worst YTD performances of the bond market in history. Again, these are supposed to be the safety diversifiers, but they just aren’t filling that role right now.
Bottom Line: I’m amazed to hear how many advisors out there are telling investors to sit tight and wait while they do nothing. Does that make sense to anyone? Our philosophy has always prioritized playing it safe as our priority. Because if we’ve played it safe through the worst of times, it will take much less time to get accounts back to even…or back to growing once the worst is over. This is when what we do is the most valuable to our clients…and we thank you for being here!

1 The Standard and Poor’s 500 is an unmanaged, capitalization-weighted benchmark that tracks broad-based changes in the U.S. stock market. This index of 500 common stocks is comprised of 400 industrial, 20 transportation, 40 utility, and 40 financial companies representing major U.S. industry sectors. The index is calculated on a total return basis with dividends reinvested and is not available for direct investment.
2 Charts are for informational purposes only and are not intended to be a projection or prediction of current or future performance of any specific product. All financial products have an element of risk and may experience loss. Past performance is not indicative of future results.