
While July turned out to be a decent month for most stock and bond indexes, August hasn’t been able to continue that momentum. As of Wednesday’s close, both the S&P 500 and the NASDAQ 100 are very close to being flat for the month. And the Aggregate Bond index is down nearly -2.0%. So while July was starting to feel like things might be turning around, August is reminding us that it may have only been a “bear market rally” and there could be more downside ahead.
Tis the season for more downside. “September is when leaves and stocks tend to fall; on Wall Street it’s the worst month of all.” – Stock Trader’s Almanac. September tends to be the lowest performing month, depending on how many years of history you are looking at. The one bright spot we noticed is that when looking at the past 20 years, Energy was the stand-out sector with the highest win rate for the month (StockCharts.com data).
The yield curve is still inverted. Didn’t we just do this? Again, historically, that tends to suggest a recession in 12 to 18 months from the inversion. So if what we are in now isn’t a “real” recession, maybe next year will be? Anything is possible.
This Friday we should have some further guidance on what the Federal Reserve plans to do going forward. Fed Chair Jerome Powell will be speaking at the annual Jackson Hole symposium. There is a lot of speculation about him saying or revealing some data point that changes how we should be thinking about the economy and markets going forward. Personally, I doubt much will change from his speech there, but we’ll see.
Our Shadowridge Long-Term Trend is barely holding on to its positive signal and our Mid-Term Cycle signal has pushed pretty far into negative territory. We’ve backed off our allocations quite a bit over the past couple of weeks – meaning we’re holding much more cash than usual. The markets got dicey fast and the last couple of times we saw that, a swift and deep decline followed. We haven’t seen the follow-through yet so maybe it was a false alarm. But in this environment, we believe it’s better to be safe than sorry.
As of Wednesday night (August 24th, 2022), our Shadowridge Dashboard showed Positive to Negative sectors as 8 to 3. Last month, the weakest sector was Energy, but now it seems to want to take the lead again. And while there are still 8 positive sectors, our early warning signals are all flashing to be careful and that we could see several more sectors move to the negative side in the near future. If that happens, we should see the rest of the push down we saw start last week.
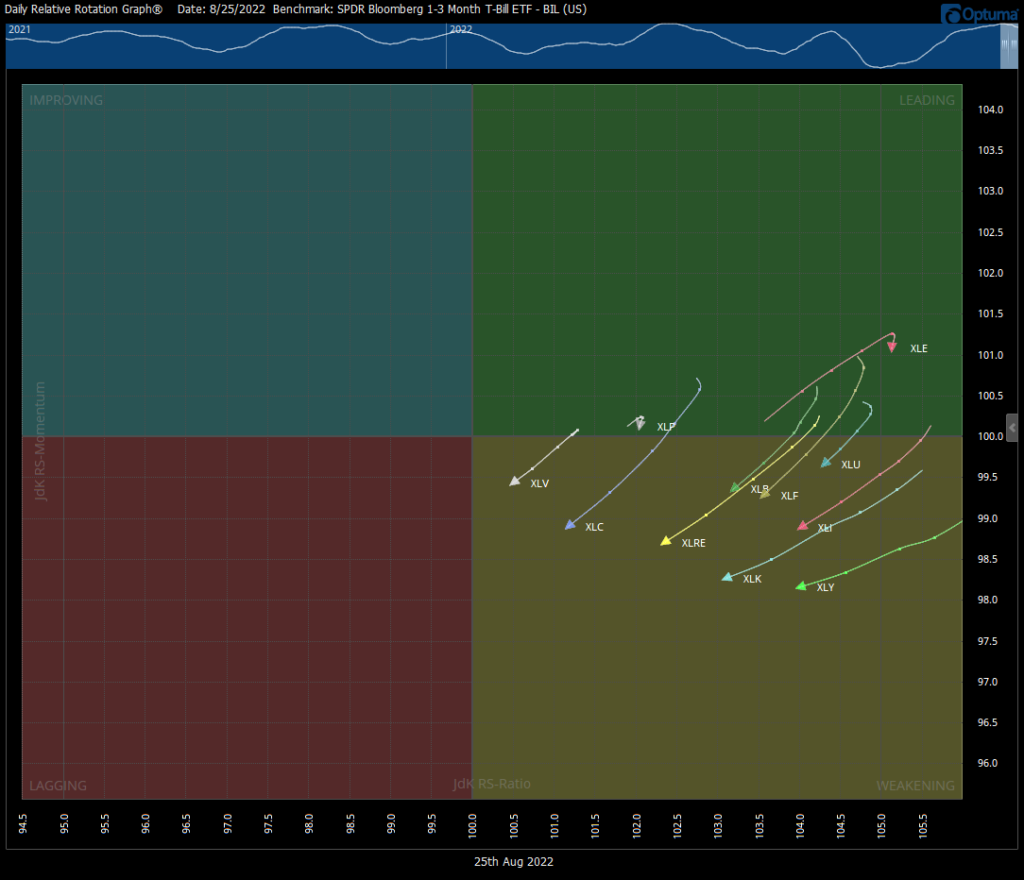
For this month’s chart, we are looking at the (RRG) relative rotation graph of all the sectors of the S&P 500. We like to look at all the parts of the index to see where it could be headed next. Right now, all the arrows are pointing down into the “weakening” area of the graph. As the market had its run up earlier this month, all the arrows moved from Lagging, to Improving, to Leading. And now the circle continues to weaken. If they all head into “Lagging,” then the index might struggle to stay positive.
Bonds – as of this writing, the Aggregate Bond Index AGG is down -10.21% YTD in 2022. The 7-10 year Treasury bond index is -11.02% this year (FastTrack Data). It looked like the worst was over for bonds, but alas weakness has returned. Our Income (Bond) model was busy getting back to being allocated, but what we bought only lasted a couple of weeks. What we do still own has defensive measures to help with the downside risk.
Bottom line – we are heading into the most historically volatile month of the year. And while there have been brief windows of positive opportunity, we may be heading for the next leg down. Or at very least, another bout of high volatility that could be jarring. Over the past couple of weeks, we’ve been easing back into defensive allocations and increasing how much cash or money market funds are being held. If the market does get worse, we are set up to take advantage of the downturn by taking small short positions (betting against the market). We’re prepared, but hopeful that future corrections are short-lived and not too extreme. Time will tell!
Stay safe out there!!

1 The Standard and Poor’s 500 is an unmanaged, capitalization-weighted benchmark that tracks broad-based changes in the U.S. stock market. This index of 500 common stocks is comprised of 400 industrial, 20 transportation, 40 utility, and 40 financial companies representing major U.S. industry sectors. The index is calculated on a total return basis with dividends reinvested and is not available for direct investment.
2 Charts are for informational purposes only and are not intended to be a projection or prediction of current or future performance of any specific product. All financial products have an element of risk and may experience loss. Past performance is not indicative of future results.