
Ok, NOW we get the pullback that was expected in the September/October period. It already looks like the wave of fear has passed and we got a common 5%-ish pullback (I’m showing -5.07% on the SPY ETF). Textbook typical, nothing out of the ordinary.
We still are in the historically “best 3 months” period for the stock market, so our expectations remain positive heading into the end of the year. We could even argue that the recent pullback gave us the set-up we needed for a December rally. Long-term trends are still positive and holding (for now), so the mentality for now is to “buy the dips” until the market proves otherwise.
In contrast to the S&P500, the NASDAQ 100 (the QQQ ETF) was down -7.88% during that same sell-off period. But when the S&P 500 sells off -5%, it’s not uncommon to see the NASDAQ pull back between -7 and -8%. So again, tech got hit a bit more than the broad index, but that sector is generally more volatile anyway.
The Federal Reserve is (again) expected to cut interest rates by -0.25% in December. But the odds of the cut have been all over the place. Currently the odds are at about 85% that it will happen. If a rate cut does happen, you can expect to see money market and savings rates decrease (again). But what is less certain is how the bond market will react. Usually, bond prices rise as rates fall, but recently we’ve seen the opposite, at least in the short-term swings.
The one most concerning factor that has been quietly creeping upwards is unemployment. While it isn’t quite showing up in government data yet, we’re seeing and hearing about it more and more locally, especially for the higher salaried jobs. If AI is, in fact, a contributing factor (hard to say at this point), that is bad for white collar jobs, but not for the blue-collar workers. AI still can’t do manual labor. This reminds me a bit of the tech bubble burst of 2000, so I am keeping an eye on this factor.
This month’s chart is a look at a longer-term trend of the S&P 500 (shown with the SPY ETF) with a 125-day moving average. Why 125? That represents approximately 6 months of price movement (a typical month is 21 trading days x 6 months = 126). In the past 5 years (shown below), this has been where the market liked to find support. And the recent pull-back didn’t even touch it. When we see the stock market cross below this line, that’s when being cautious is warranted. But above the line, it’s a buy-the-dip situation, as mentioned.
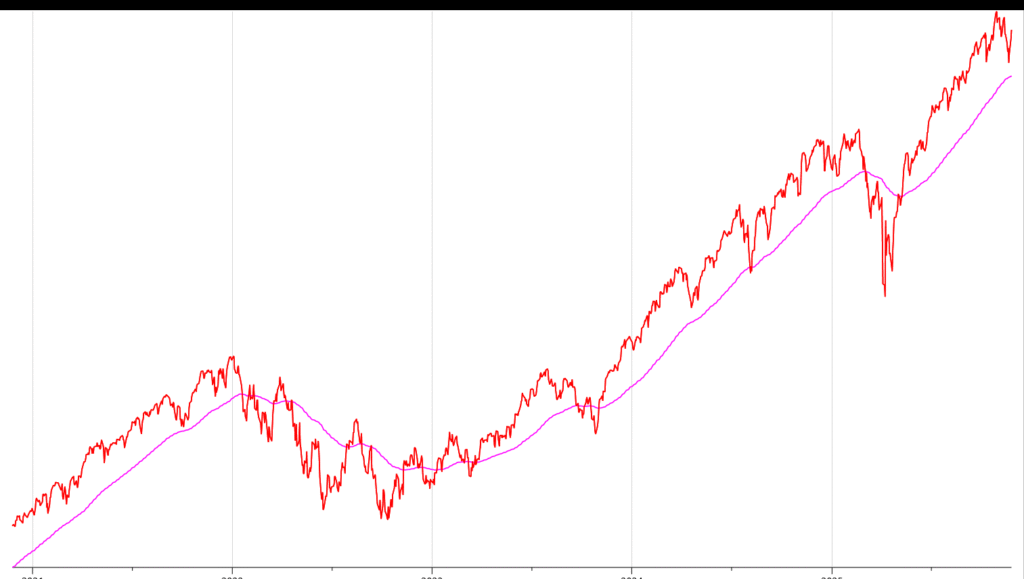
Five-year chart of the S&P 500 (SPY ETF) and the 125-day moving average (Source: Investors FastTrack)
Our Shadowridge Long-Term Trend indicator crossed below its longer-term trend and did hold below for a few days. But as of Thanksgiving week, it has crossed back above. For now, the long-term trends are holding up.
Our Mid-Term Cycle indicator also turned positive after a sharp decline in money flow stats. However, it too pulled a sharp reversal and turned positive this week.
As of Wednesday night (November 26th, 2025), our Shadowridge Dashboard showed Positive to Negative market sectors as 8 to 3. The weak sectors are Technology, Industrials, and Communication. But, as I mentioned, this reversal has been broad, so I’d expect them all to be positive in the next couple of days.
Right now, all 10 RGB Bond Indexes are trending positive, above their 50-day Moving Averages. Strength continues to lean toward the Economically sensitive bond sectors.
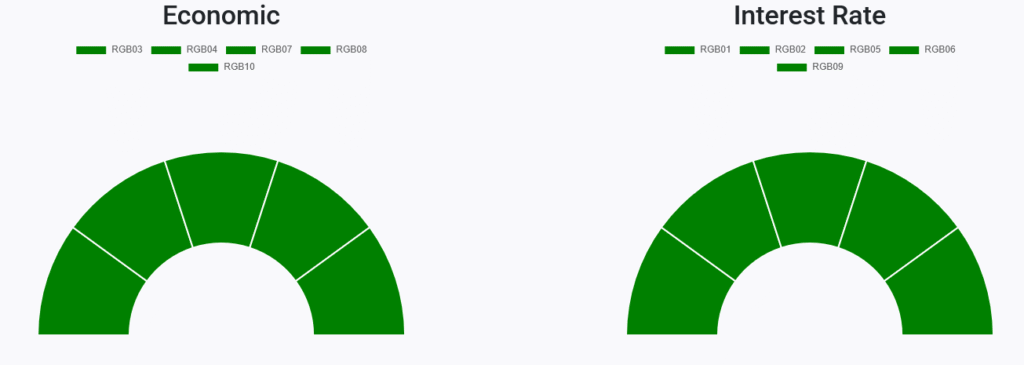
RGB Economic and Interest Rate Sensitive Bond sectors (Source: ShadowridgeData.com)
Bond sectors continue upward, still following the movement of the stock market (pullbacks included). Correlations still aren’t helping to offset stock market risk as they have historically, and we don’t expect them to work the same way for quite some time. The bond cycle tends to be 40 years, and the cycle so many “advisors” lean into won’t likely work in the future as it did in the past.
Bottom Line: Volatility has returned, but just enough to give us a standard 5% market pullback in the S&P 500. It gave us a nice entry point to add new money into our models and even nudge them slightly more into the market. For now, the big picture is positive. But cracks are beginning to be more evident in the data, so our outlook in 2026 isn’t as positive as the past two years. Investors who think the trends of the past couple of years are sustainable could find the next year to be more challenging. We, on the other hand, are well positioned to take advantage and look forward to this environment change.
Stay safe out there!

1 The Standard and Poor’s 500 is an unmanaged, capitalization-weighted benchmark that tracks broad-based changes in the U.S. stock market. This index of 500 common stocks is comprised of 400 industrial, 20 transportation, 40 utility, and 40 financial companies representing major U.S. industry sectors. The index is calculated on a total return basis with dividends reinvested and is not available for direct investment.
2 Charts are for informational purposes only and are not intended to be a projection or prediction of current or future performance of any specific product. All financial products have an element of risk and may experience loss. Past performance is not indicative of future results.