
We are now 25% through 2024 and it has been a pleasant surprise so far, especially after the higher volatility market we’ve seen over the past couple of years. A calm market tends to slowly grind up. And as we’ve observed before, the upward movement in this market is still concentrated in the S&P 500 and NASDAQ. Small Cap (Russell 2000) and Emerging Markets are both just barely positive on the year. We continue to be in a market where traditional “diversification” doesn’t do you any favors, as I’ve mentioned in past newsletters (most recently in November).
The election year seasonality expectations are still fairly low right now, until we get into the summer months. The market seems to want to continue its grind up, so we are cautiously participating in as much as we find reasonable. Election year environments do tend to get a bit crazy in the final months, but for now, we’re in a period where not much happens. So we’re going to enjoy this upward grind while it lasts.
There is a lot of debate on whether or not (or how many times) the Federal Reserve will cut interest rates this year. Some of the original estimates were as many as 5 or even 7 times in 2024. However, that seems to have slowed to 2 or 3 rate cuts likely this year. However, there is also a case for no rate cuts at all. But I do know that the yield curve is STILL inverted, so the potential of seeing a recession still lingers way off in the distance.
Our Shadowridge Long-Term Trend indicator remains positive since its signal in the middle of November. There haven’t even been any significant pull-backs to buy into recently. In fact, the S&P 500 hasn’t had a pull-back of more than 2% since this rally began last November.
Our Mid-Term Cycle is back to positive after a couple of short bouts of negative money flow. And even though this metric hasn’t been particularly strong this year, the market has been able to make a slow grind forward (and upward).
As of Wednesday night (March 27th, 2024), our Shadowridge Dashboard showed Positive to Negative market sectors as 11 to 0. While it is nice to see everything positive across the market, we believe there still appears to be a need to be cautious in case of a quick reversal of sentiment (which we’ve seen happen before).
This month’s chart shows the ratio (sometimes referred to as “Relative Strength”) between the NASDAQ 100 (QQQ) and the S&P 500 (SPY) ETF representations of each index. The Red line is the 5-day EMA (Exponential Moving Average) and the Blue line is the 21-day EMA. The 5 represents one week of movement and the 21 represents one month: so this ratio is one week vs one month between the two. What I’m watching for is which index is leading. If the lines are moving up and Red is above Blue, then the QQQ is stronger. If Red is below Blue, then the SPY is stronger. In a majority of cases, when the QQQ is leading, this suggests a strong market (and vise-versa). Right now, the SPY is stronger. That suggests caution looking into the near future.
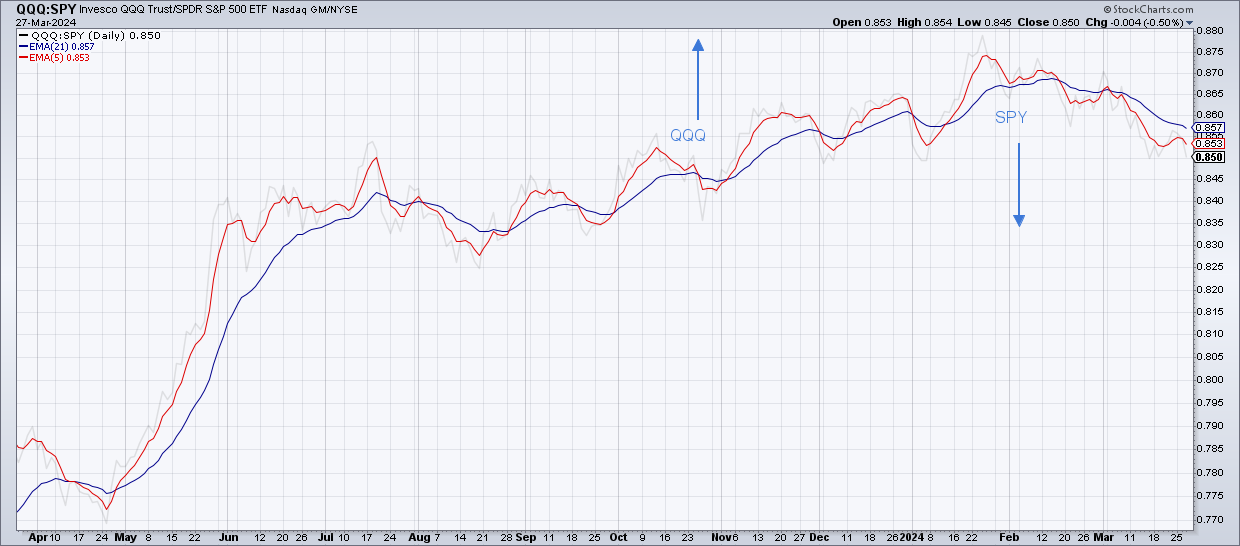
The past one year of the ratio of the S&P 500 to the NASDAQ 100 (Source: StockCharts.com)
The Bond Indexes (both the Aggregate and the 10-year Treasury) remain negative Year-to-Date in 2024. And while they’ve both improved slightly in the past 30 days, they are also doing little to help out a “diversified” portfolio. Which is why we’ve largely avoided them until recently. We have dipped slightly into the Aggregate Bond Index on its recent positive shift in strength. However, we are still focused on Floating Rate and High Yield bonds, which are both positive this year with lower volatility than the Aggregate Bond Index.
Bottom Line: Market health remains positive at the moment, but we have to be very selective about where to put money, as the choices are still limited. Concentration into domestic Large Cap and Growth are where we want to be (and have been) focused until we see a relative strength shift. And that shift may be in its early stages. We are ready to change with it when that eventually happens.
Stay safe out there!

1 The Standard and Poor’s 500 is an unmanaged, capitalization-weighted benchmark that tracks broad-based changes in the U.S. stock market. This index of 500 common stocks is comprised of 400 industrial, 20 transportation, 40 utility, and 40 financial companies representing major U.S. industry sectors. The index is calculated on a total return basis with dividends reinvested and is not available for direct investment.
2 Charts are for informational purposes only and are not intended to be a projection or prediction of current or future performance of any specific product. All financial products have an element of risk and may experience loss. Past performance is not indicative of future results.