
Ray Dalio is a hedge fund manager that I really appreciate for his Zen-like ability to cut through the noise of the marketplace and make his decision making so clear. The following are excerpts from his recent paper on how he determines if we are in a stock market bubble or not.
[Begin copy]
I define a bubble market as one that has a combination of the following in high degrees:
- High prices relative to traditional measures of value (e.g., by taking the present value of their cash flows for the duration of the asset and comparing it with their interest rates).
- Unsustainable conditions (e.g., extrapolating past revenue and earnings growth rates late in the cycle when capacity limits mean that that growth can’t be sustained).
- Many new and naïve buyers who were attracted in because the market has gone up a lot, so it’s perceived as a hot market.
- Broad bullish sentiment.
- A high percentage of purchases being financed by debt.
- A lot of forward and speculative purchases made to bet on price gains (e.g., inventories that are more than needed, contracted forward purchases, etc.).
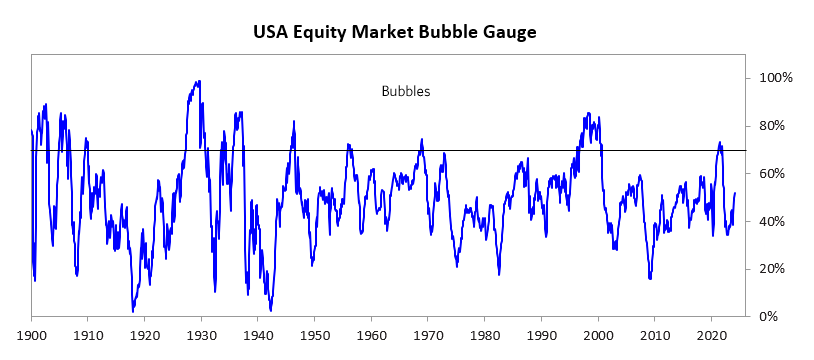
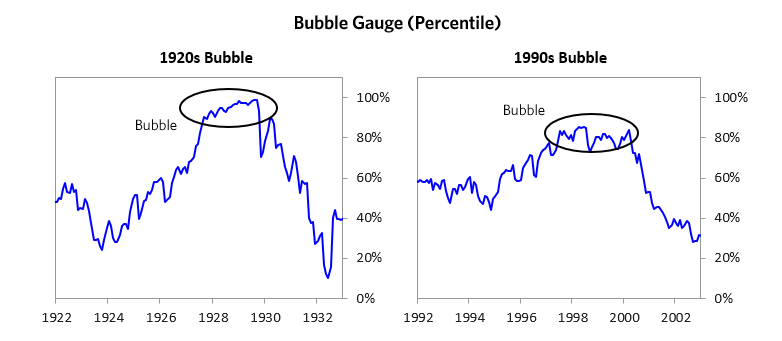
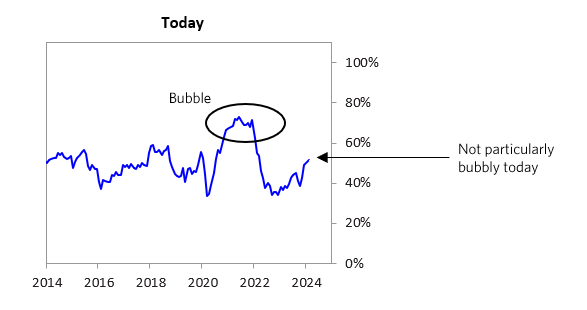
I apply these criteria to all markets to see if they’re in bubbles. When I look at the US stock market using these criteria (see the chart below), it—and even some of the parts that have rallied the most and gotten media attention—doesn’t look very bubbly. The market as a whole is in mid-range (52nd percentile). As shown in the charts, these levels are not consistent with past bubbles.
The “Magnificent 7” (stocks of Amazon, Netflix, Alphabet, Meta, Apple, Microsoft and Nvidia) has driven a meaningful share of the gains in US equities over the past year. The market cap of the basket has increased by over 80% since January 2023, and these companies now constitute over 25% of the S&P 500 market cap. The Mag-7 is measured to be a bit frothy but not in a full-on bubble. Valuations are slightly expensive given current and projected earnings, sentiment is bullish but doesn’t look excessively so, and we do not see excessive leverage or a flood of new and naïve buyers. That said, one could still imagine a significant correction in these names if generative AI does not live up to the priced-in impact.
In the remainder of this post, I’ll walk through each of the pieces of the bubble gauge for the US stock market as a whole and show you how recent conditions compare to historical bubbles. While I won’t show you exactly how this indicator is constructed, because that is proprietary, I will show you some of the sub-aggregate readings and some indicators.
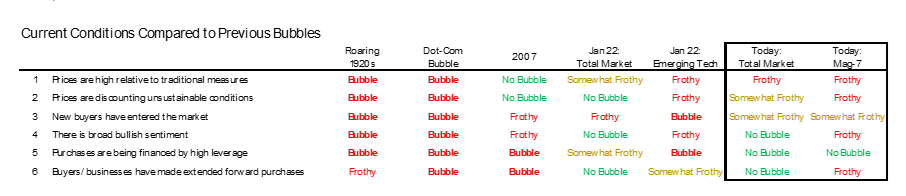
Each of these six influences is measured using a number of stats that are combined into gauges. The table below shows the current readings of each of these gauges for the US equity market. It shows how the conditions stack up today for US equities in relation to past times. Our readings suggest that, while equities may have rallied meaningfully, we’re unlikely to be in a bubble.
For the Mag-7, some of our readings look frothy, but we do not see bubbly conditions in aggregate. We have somewhat lower confidence in this determination because we don’t have a high-confidence read on how impactful generative AI will turn out to be, and that is a significant influence on the expected cash flows of many of these companies.
[End copy]
(Will here again) I agree with this Goldilocks market that Dalio describes. It is not too hot, and not too cold. For this reason, Shadowridge has some investment models with very low stock market exposure, and others that have up to 80% exposure to stocks at the moment. In this way we can participate in moves up in the stock market, but have plenty of cash reserves with which to buy if the market declines from here.
Dalio’s full report is 16 pages long with plenty of detail and charts on the six conditions he analyzes to generate this report. The full report can be seen on LinkedIn at by clicking here: Are We in a Stock Market Bubble?
