It’s a new year and the momentum of the stock market is attempting to carry through into the new year. The first three days of 2024 were down, but once we got through the first five days, the S&P 500 was only slightly negative (basically flat). There are theories about how the “First Five Days of January” can indicate how the rest of the year plays out. I’m not sure this is giving us much of a signal for how 2024 will play out. But there are other theories and signals to watch for.
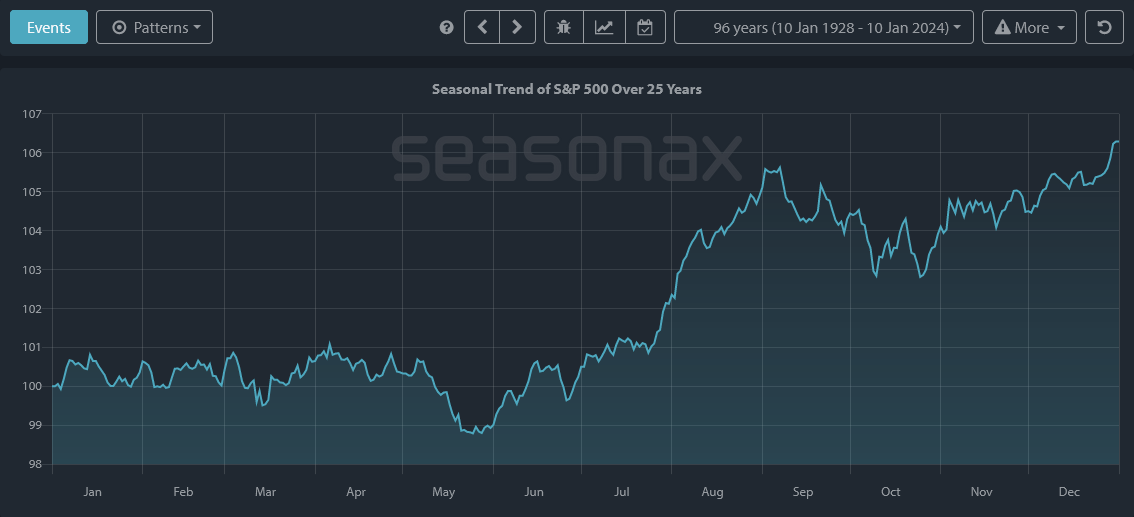
It’s an election year! On our monthly webinar in January, I shared a chart of how each Election Year has played out – all the way back to 1928. There were 25 election years in that period! What stood out to me is an unusual pattern: the market tends to “chop” sideways for the first 6 months before having a solid, early-summer rally. This is the opposite to the “Sell in May and Go Away” mantra. So we’ll be watching that time period closer than usual this year with an eye for potential buying instead of the usual selling.
To repeat a paragraph from last month’s Market Commentary:
Next year (2024) is still a good year in the “Election Cycle” and suggests we may get another positive year in the market. How we get there is another story. As I mentioned last month, 2024 has a 73.91% chance of being positive, based on previous election years (Seasonax data). Those are some pretty good odds to have in our favor.

S&P 500 Seasonality in past 25 Election Years back to 1928 (Source: Seasonax)
Our Shadowridge Long-Term Trend indicator remains positive since its signal in the middle of November. We haven’t seen it hold that long in a couple of years at this point. Maybe there is still some fuel left to keep it moving upward over the next several months.
However, our Mid-Term Cycle signal turned negative on January 3rd and has given us reason to think that this run is taking a break. What has been the most baffling is that for much of the month, it was giving us a reading of -500 or more, which historically has corresponded with a vigorous market sell-off. But this January just kept on grinding along slowly sideways and even slightly upward.
As of Wednesday night (January 23rd, 2024) our Shadowridge Dashboard showed Positive to Negative market sectors as 7 to 4. Energy is still on the weak side, as it has been for months now. And with it is Real Estate, Utilities, and Materials. Strength has returned to the Technology and Communications sectors. So that, technically, is growth getting back into the lead, even if movement tends to be weak right now.
The part that has yet to convince me that things are all OK is that Small Cap has gone back to being the weak part of the market. In December, Small Cap stocks finally left their rut and took leadership over most market style boxes. Seeing that broad participation was a positive for broad market context. But that has since faded back to where Small Cap is the laggard of market styles and it is showing a negative YTD return. So we’re back to a split between a select few stocks doing well while the rest of the broad market is stagnant.
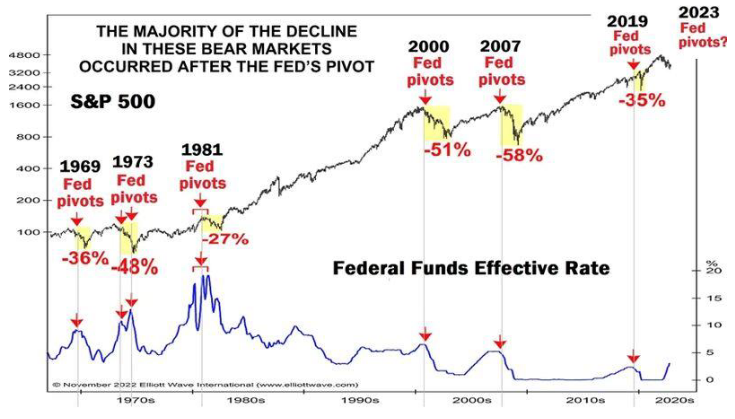
This month’s chart is also from my January webinar and comes from SYZ Private Bank / Phoenix Capital. I’m hearing a lot of talk about how falling interest rates should be good for the economy. And while there are aspects of the economy that could get a boost, like housing loans, a falling rate environment historically hasn’t been the best environment for the stock market. As you can see from the chart below, each time the “Fed Pivots” and begins to reduce interest rates, the S&P 500 tends to have a correction (or something more dramatic) shortly after this pivot. It doesn’t have to happen again this time, but it does align with other factors we’re considering about how the next major correction could play out.
 The past 60+ years of the S&P 500 and when the Federal Reserve cut interest rates (Source: SYZ Private Bank / Phoenix Capital)
The Bond indexes (both the Aggregate Index and the 10 Year US Treasuries Index) had a good Q4 in 2023 as well, after having an ugly couple of years. However, we’ve spent some time with the Seasonality of those indexes, and we observed that this follows a typical pattern which could be done around the end of January. We’re also keeping in mind that when interest rates eventually start falling, this should create a positive environment for bonds. That may still be a few months away – maybe after the seasonally weak time period. But we could again see conditions this year where the Bond market could be a safe haven while the Stock market(s) fall – something we haven’t seen over the past couple of years.
Bottom Line: It’s been a good run and now our data is back to being split as to how healthy this stock market really is. We’ve backed off on our allocations and market exposure because we find things can go wrong much faster in these split environments. We’ll continue to have some, but not all, money invested until we get better clarification on what this market wants to do next. We had solid gains in 2023 that I want to make sure we are ready to defend when the time comes.
Stay safe out there!

1 The Standard and Poor’s 500 is an unmanaged, capitalization-weighted benchmark that tracks broad-based changes in the U.S. stock market. This index of 500 common stocks is comprised of 400 industrial, 20 transportation, 40 utility, and 40 financial companies representing major U.S. industry sectors. The index is calculated on a total return basis with dividends reinvested and is not available for direct investment.
2 Charts are for informational purposes only and are not intended to be a projection or prediction of current or future performance of any specific product. All financial products have an element of risk and may experience loss. Past performance is not indicative of future results.

