We’re now looking at the end of 2023 and wow, what a year it was. Until the last couple of months, so much of the market had just gone nowhere. But the November run up (which was seasonally expected) and the continued run up in December (not as seasonally expected) gave the laggards a chance to catch up. And they absolutely have! But what’s next?
We think it would have been more ideal to have at least some sort of pull-back in the market in early December to set us up for a rally into the year-end. Seasonality suggests that would have been a good set up to carry us well into January. But since a December pull-back wasn’t what we got, I’m slightly less optimistic for how January plays out.
Next year (2024) is still a good year in the “Election Cycle” and suggests we may get another positive year in the market. How we get there is another story. As I mentioned last month, 2024 has a 73.91% chance of being positive, based on previous election years (Seasonax data). Those are some pretty good odds to have in our favor.
But, like in all market environments, there are potential troubles ahead. The Yield Curve is still inverted (since July 2022) and that tends to lead recession by 12-18 months. Will that still happen? Who knows? But it’s worth keeping in mind.
We’re also seeing a rise in debts not being paid back (student loans, car payments, and more). Eventually that will catch up and impact the economy. Will it be a small impact or a massive one? Again, who knows? It’s another thing to keep in mind.
The other, somewhat surprising element for 2024, is that the Federal Reserve says they are going to start cutting interest rates – possibly 3 times. Now, historically, the Fed only cuts rates when there are concerns of an economic slowdown. Previous times when rates were cut include: January 2001, September 2007, and July 2019. Anybody else see a pattern? …worth keeping in mind.
Our Shadowridge Long-Term Trend indicator went positive around the middle of November…and stayed that way through the end of December. That’s notable because it’s been a while since we’ve seen persistence in market sentiment – one way or another.
Our Mid-Term Cycle signal turned positive on November 1st and has remained strong throughout the entire month. And again, it remains positive since that last signal. It has been a while since a market run remained intact for this length of time.
As of Wednesday night (December 27th, 2023) our Shadowridge Dashboard showed Positive to Negative market sectors as 11 to 0. Energy has remained the weak sector – even through most of December. But it too crossed over and supports the strength of this market rally. However, 5 sectors are now giving me an early warning that they may be moving back to negative soon. Eventually it does happen, but for now we’ll just keep enjoying the rally.
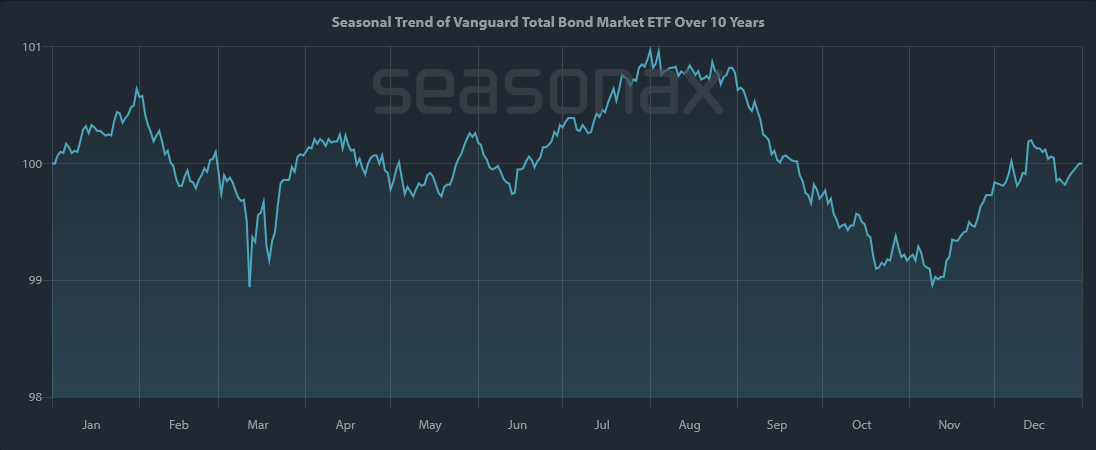
For this month’s chart, I want to share what I have been looking at regarding the seasonality of the Bond market – looking at the BND (Vanguard Total Bond Market) ETF over the past 10 years. In this context, it seems obvious that the bond market tends to fall from July to November and then rally into December. This is almost exactly what the bond market did this year. Market movements aren’t as random as so many believe. What happens next? It looks like the move up usually continues into the end of January, then drops. I guess we’ll have to see how it plays out in 2024.

Ten-year seasonality of the Vanguard Total Bond Market ETF (BND) (Source: Seasonax.com)
The bond market, as shown above, had a good run up after being negative Year-to-Date at the end of October. Then it moved up into December (as seasonality suggested) and could continue until the end of January. But does it now have the strength to continue? Bond prices rise on falling interest rates. So if rates do continue to fall, the bond market might look like a place to park money again. We remain cautious for now, as short-term bonds and money market funds are still paying over 4% with little to no price volatility. But when that changes, so will we.
Bottom Line: Most markets (stocks and bonds) had great runs in November and December. Seasonality was a key factor we used to get more aggressive than we’ve been in many months – and that has paid off for us. But where do we go next? It doesn’t matter what we think the market will do, but more importantly how we react when seasons change. We still believe in a “safety first” philosophy and are ready to play it safe again when this run is over.
Wishing you all the best in 2024 – Stay safe out there!

1 The Standard and Poor’s 500 is an unmanaged, capitalization-weighted benchmark that tracks broad-based changes in the U.S. stock market. This index of 500 common stocks is comprised of 400 industrial, 20 transportation, 40 utility, and 40 financial companies representing major U.S. industry sectors. The index is calculated on a total return basis with dividends reinvested and is not available for direct investment.
2 Charts are for informational purposes only and are not intended to be a projection or prediction of current or future performance of any specific product. All financial products have an element of risk and may experience loss. Past performance is not indicative of future results.

