
Seasonality strikes again! It should be no surprise that September has been a weak month across most of the stock market, as historically it has the highest probability of any month to see losses. And this year is no different. However, what this does do is set up the market for a good rally into the end of the year.
As of Wednesday, Sept 27th, the three major US Indexes have all had drawdowns with somewhat ordinary depth: S&P 500 -6.6%, NASDAQ-100 -8.0% and the Russell 2000 (Small cap) -11.8%. But since September is historically the weakest month, this seems to be right on schedule.
So, as we head into the end of the “Sell in May…” season (which usually ends somewhere in mid-October), we believe this pullback could be a good entry for getting more aggressive going into the end of 2023. We’ve been spending time comparing the seasonality of different parts of the market: value, growth, large cap, small cap, US Dollar, International, and Emerging Markets. A fun find is that over the past several decades, the typical October bottom has moved from the end (usually around the 27th) of the month to the middle (somewhere between the 12th and 15th) of the month.
And have I mentioned that the Yield Curve is still inverted? Well, it still is. It’s been that way for months now and the Federal Reserve may not be done raising rates. There remain problems down the road for when this unwinds, but that is still a long way off.
Our Shadowridge Long-Term Trend indicator remains negative but is now very much stretched to the down-side. This matches up with our seasonality observation that we could be seeing the bottom of this pullback in the near future.
Our Mid-Term Cycle signal has also remained negative. And it too is stretched, but not as much as the long-term indicator. That could push the bottom out an extra week or two. But this data is more sensitive, so it could quickly change direction.
As of Wednesday night (September 27th, 2023), our Shadowridge Dashboard showed Positive to Negative sectors as 1 to 10 – the same as it was at the end of August. The only positive sector has been Energy. And while Energy has been up when most other sectors have been down, it hasn’t been a straight line. It, too, has seen choppy movement.
This month’s chart is – that’s right! – a Seasonality chart of the S&P 500. It shows the average movement of each day of the year. The purple line is where we are as of this writing. This visually shows how August and September are historically negative, while a bottom tends to happen in October before going up through the end of the year. One other interesting point is that December (at least lately) hasn’t been as strong as it has been in the past. It looks like the Santa Clause rally is really more of a Thanksgiving Rally. Certainly something we’ll be watching more closely now.
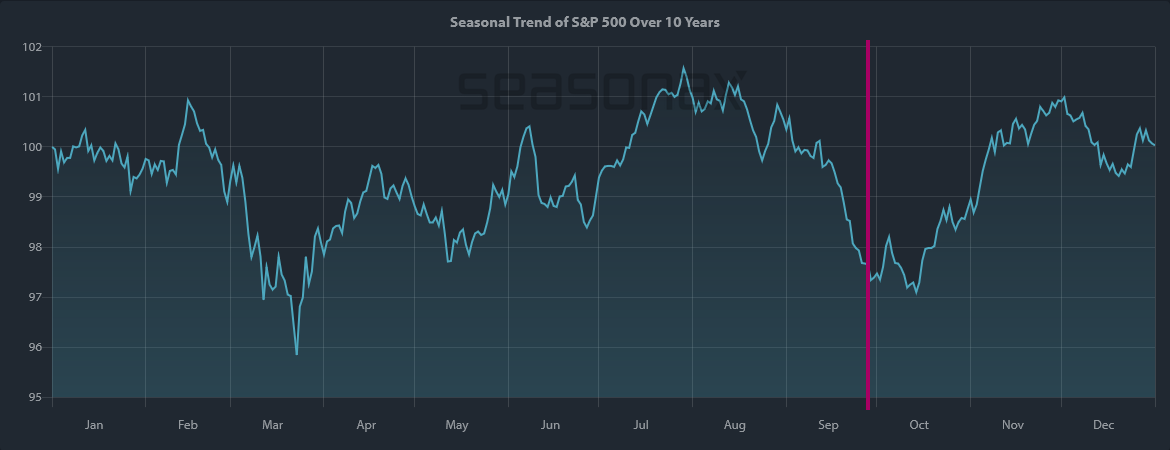
Seasonality chart of the S&P 500 over the past 10 years (Source: Seasonax)
Both the Aggregate Bond Index (AGG) and the 10 Year Treasury Index (IEF) are still DOWN year-to-date. Both peaked around May of this year and have moved steadily downward since. There just hasn’t been any reason to take on Bond market risk. It hasn’t been the “diversifier” it should be.
What concerns me now is that so many investors out there have money in investments like Target Date funds. These types of funds move money more into bonds for “safety” as the investor ages. In the current market environment, that does more harm than good. The reality is these funds are much more risky than most investors believe.
Still, ultra-short bonds and money market equivalents are the place to be, since these assets can get you around 5% return at the moment with very low risk. And this is where we continue to focus our fixed income money, rather than the traditional bond indexes. That has paid off well for our investors in the past 2 years.
Bottom Line: We’ve spent most of the past two months in a reduced-risk allocation. Meaning our stock (and bond) market exposure has been below (typically around half of) what full strength might look like. But now that seasonal factors suggest the next leg up should be starting soon, we’re preparing to take advantage of that as much as we can.
Stay safe out there!

1 The Standard and Poor’s 500 is an unmanaged, capitalization-weighted benchmark that tracks broad-based changes in the U.S. stock market. This index of 500 common stocks is comprised of 400 industrial, 20 transportation, 40 utility, and 40 financial companies representing major U.S. industry sectors. The index is calculated on a total return basis with dividends reinvested and is not available for direct investment.
2 Charts are for informational purposes only and are not intended to be a projection or prediction of current or future performance of any specific product. All financial products have an element of risk and may experience loss. Past performance is not indicative of future results.