
As August began, it wasn’t much of a surprise to see the market start to pull back a bit from its over-stretched and over-bought conditions. The stock market can only run up (or down) like that for so long before it needs to take a break. It often reverts back to an average price of the past month (or 21-day moving average), and that is what we saw play out over the past few weeks.
And let’s not forget that seasonality is a relevant factor to keep in mind. While the Election cycle says we should expect a good year overall, the August through October period still has a high probability of loss based on seasonality. The saying “Sell in May and go away” is based on actual data. History shows that the market tends to struggle over the summer and fall seasons, while most market returns occur in the winter and spring. The Stock Trader’s Almanac has done extensive research on this topic (if you want to learn more or don’t believe me).
Another factor we’ve been watching more closely (many thanks to Rob Hanna of Quantifiable Edges) is the ratio between the NASDAQ and the S&P 500. His research shows that when the NASDAQ is stronger, the market tends to be in a growth mode. And when the S&P 500 is leading, that tends to be either a resting period or a bearish market period. We recently saw a shift from NASDAQ leadership to S&P 500, so we are keeping that in mind. A choppy or down period may be ahead.
The Yield Curve is still inverted. I’ve covered this quite a bit in past months. I can only add the observation of how odd it is for the Yield Curve to stay inverted for this long. It still is a signal of trouble ahead. But how far ahead? That is the big question.
Our Shadowridge Long-Term Trend indicator went negative in the middle of August, after getting very much stretched to the up-side. A market pullback was only a matter of time.
Our Mid-Term Cycle signal has been negative since the beginning of August. Based on that factor and some seasonality concerns, we used that as a good place to take some profits and reduce our market exposure quite a bit. With both the Long-Term and Mid-Term signals negative, now is a time to sit and wait for a new entry point, while enjoying some good interest available in Money Market funds, which we haven’t seen for quite some time.
As of Wednesday night (August 23rd, 2023), our Shadowridge Dashboard showed Positive to Negative sectors as 1 to 10 – the complete opposite of where we were at the end of July. Both defensive and offensive market sectors suggest the market needs to take a break for a while before it can resume its upward trend into the end of the year. That is, at least, what we are expecting.
This month’s chart is what I share on Twitter each Friday. It shows the Relative Rotation (RRG) of each of the eleven S&P 500 sectors against T-Bills and in what direction the winds are shifting. When most of the sectors are in or moving into the bottom left “Weakening” (Red) quadrant, that is when things are slowing down. When we start to see several of the sectors move up and cross into the upper left “Improving” (Blue) quadrant, that is when we expect to see strength coming back into the market indexes.
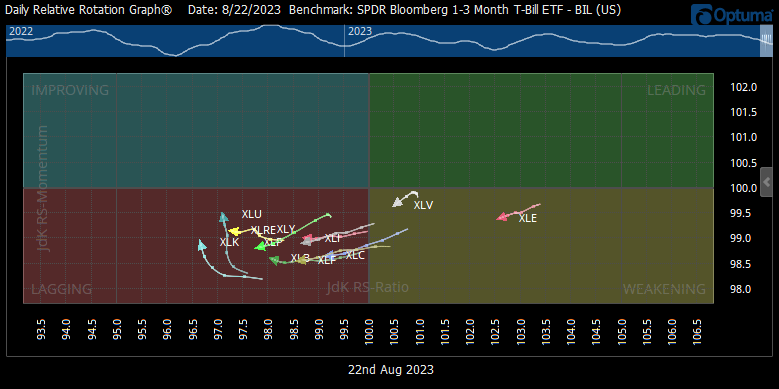
RRG (Relative Rotation Graph) of the S&P 500 index sectors vs T-Bills. (Source: Optuma)
Both the Aggregate Bond Index (AGG) and the 10 Year Treasury Index (IEF) are now DOWN year-to-date. Both peaked over 3 months ago and have moved steadily downward since then. Still, ultra-short bonds and money market equivalents are the place to be, since these assets can get you around 5% with very low risk. I think there will be a time again for traditional bond sectors to be attractive. But right now, they just aren’t.
Bottom Line: we reduced our equity exposure quite a bit since the beginning of August and that has served us well as the market has continued on a downward grind. We are looking for the S&P 500 to dip -5.0% (NASDAQ -7.0%) off of its recent highs to start looking for a good entry point. This week we got very close (while the NASDAQ did cross that line). At the moment, I don’t believe the “bull” market cycle is over and we could still see a strong finish to the year. But for now, there are a lot of reasons to play it safe. So we are.
Stay safe out there!!

1 The Standard and Poor’s 500 is an unmanaged, capitalization-weighted benchmark that tracks broad-based changes in the U.S. stock market. This index of 500 common stocks is comprised of 400 industrial, 20 transportation, 40 utility, and 40 financial companies representing major U.S. industry sectors. The index is calculated on a total return basis with dividends reinvested and is not available for direct investment.
2 Charts are for informational purposes only and are not intended to be a projection or prediction of current or future performance of any specific product. All financial products have an element of risk and may experience loss. Past performance is not indicative of future results.