I think this year’s stock market seasonality got the June/July results backwards. Little was expected in June, but the month turned out well. July is usually expected to be a good month, but has been underwhelming. At least, not as positive as we were expecting. But I should also note that many market indexes ended June a bit overbought, so they had to pull back first before continuing their move higher in July.
We’ve also noticed some interesting shifts in strength in the past few weeks. Value has been getting stronger than Growth. The S&P 500 has taken a lead over the NASDAQ 100. Largely, the weak parts of the market so far this year have been getting stronger while the strongest parts (mostly those “7” stocks mentioned last month) have slowed down dramatically. As of Wednesday, July 26th, 2023, Apple (AAPL), Microsoft (MSFT), and Amazon (AMZN) are all down for the month.
The Federal Reserve raised interest rates 0.25% …again. But the news around the highly expected announcement was underwhelming. I’m not sure they should be pushing rates too much further. My concern is that they over-do it and the economy gets hit even harder at some point in the future. But the Fed is now saying that they believe recession is less likely. We still look at the yield curve and find it hard to agree with that assessment. Of course, I could be wrong on this and for the sake of many people’s jobs, I hope I am.
Reading Tom McClellan’s weekly Chart in Focus, I tend to agree with his assessment that unemployment tends to follow the yield curve. And when the yield curve un-inverts at some point, the expectation is that we see a spike in unemployment and then a weak economy. That could be many months away, but we can’t rule out that possibility.
Our Shadowridge Long-Term Trend indicator remains positive and supports the current run up we’re seeing in the major indexes. It could be stretched at this point, but at the moment, money flow supports the positive moves we’ve been seeing over the past couple of months.
Our Mid-Term Cycle signal has been positive since the end of June. But unlike the spikes in money flows we saw in January and March; the June and July data has been much more subdued. It has also been weakening over the past several days.
As of Wednesday night (July 26th, 2023), our Shadowridge Dashboard showed Positive to Negative sectors as 10 to 1. This also backs up the positive momentum we’ve seen. However, 4 sectors are giving an early-warning heads-up that they are weakening: Communications (XLC), Industrials (XLI), Technology (XLK), and Consumer Discretionary (XLY). These are also made up of the big tech names that were so strong during the first half of the year, so maybe things are starting to shift away from their leadership.
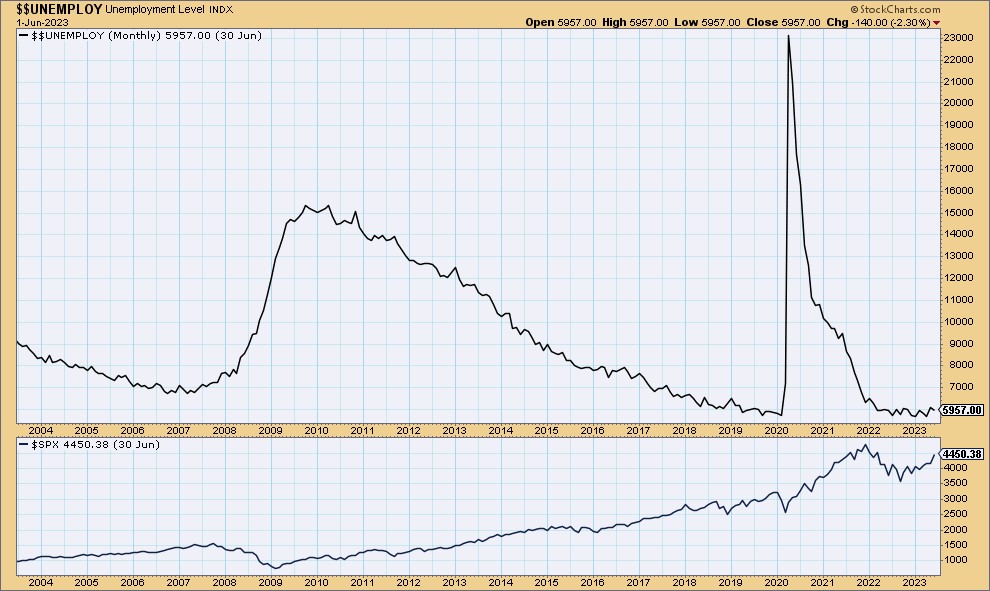
Since I’m harping so much on unemployment this month, I thought it was worth a look visually. The chart below compares the US unemployment rate with the S&P500. Put simply, when the unemployment rate rises, that generally corresponds to a falling stock market. This was certainly the case in 2007 to 2009 and during the 2020 COVID spike. The 2022 bear market does stand out as an outlier, with no spike in unemployment.

Twenty-year chart of Unemployment data above the S&P 500 index. (Source: StocksCharts.com)

1 The Standard and Poor’s 500 is an unmanaged, capitalization-weighted benchmark that tracks broad-based changes in the U.S. stock market. This index of 500 common stocks is comprised of 400 industrial, 20 transportation, 40 utility, and 40 financial companies representing major U.S. industry sectors. The index is calculated on a total return basis with dividends reinvested and is not available for direct investment.
2 Charts are for informational purposes only and are not intended to be a projection or prediction of current or future performance of any specific product. All financial products have an element of risk and may experience loss. Past performance is not indicative of future results.

