
Here we are, half way through 2023 already! While things seem to look OK when you look at major indexes (like the S&P 500 or the NASDAQ 100), there are definitely some issues underneath the surface we have to remain aware of.
You’d think the market is healthy with the major indexes moving higher. However, digging into the market sectors tells a different story. Energy, Financials, Health Care, and Utilities are all down for the year. The positive sectors are primarily Technology (think Microsoft, Apple, and NVIDIA), Communications (Meta/Facebook, Google/Alphabet, and Netflix), and Consumer Discretionary (think Amazon and Tesla).
Digging even deeper than that, only a small handful of stocks are driving these sectors, and indexes, higher. The rest of the market is not a pretty sight. And where have we seen this before? The Technology crash of 2000. The bull market in 2007 before the financial crisis. And more recently, in the 2nd half of 2021 just before the 2022 market sell-off began.
Now, all that being said, as long as the indexes (and Technology sectors) are trending, we need to stay somewhat invested. Even with issues under the surface, it is unwise to fight the trend. So we remain at a “balanced” allocation for now, being a little over half invested in the majority of our portfolios, so that any sudden shock shouldn’t affect us too much.
Like many others, I would have bet that the Federal Reserve would be done raising rates after this last announcement earlier this month. But nope, I was wrong on that. They are now suggesting not one, but two more possible increases this year. My gut feeling on this is that they are now pushing rates too far and we could start to see parts of the economy break. We’ll be watching closely to see how it all plays out.
Our Shadowridge Long-Term Trend indicator is on the edge of being positive, but still can’t quite seem to make up its mind. If anything, this indecision suggests that the market really isn’t trending anymore, but more meandering in a less-than-meaningful way.
Our Mid-Term Cycle signal is still negative, even after a couple of weeks of positive money flow. And again, just like last month, we’ve used that to lower stock market exposure.
As of Wednesday night (June 28th, 2023), our Shadowridge Dashboard showed Positive to Negative sectors as 6 to 5. As mentioned above, the strength remains largely in Technology, Communications, and Consumer Discretionary. Oddly the defensive sectors are looking the worst: Utilities and Consumer Staples.
This month’s chart is something we look at daily and it gives us a sense of market health. It is the ratio between the price of the NASDAQ 100 vs the S&P 500. When the lines are moving up, then the NASDAQ (and generally Tech stocks) are leading. When the line is moving down, the broad market is doing better than Tech. Why is this important? Technology and Growth stocks are what tend to lead the market higher. If that relationship reverses, then we know the market is weak. That’s when we start thinking about becoming more defensive or at least look at the defensive sectors for leadership.
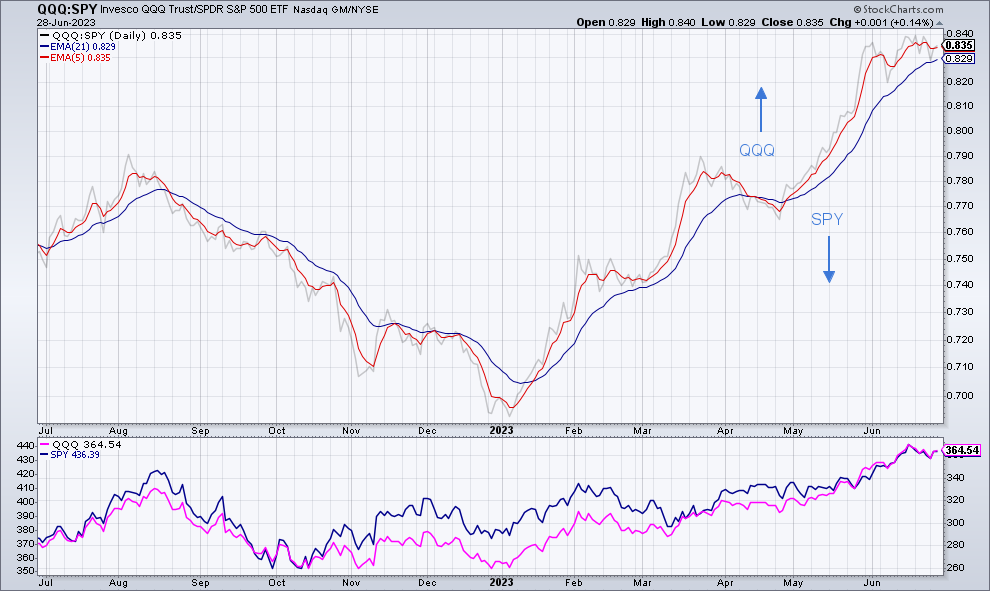
One Year chart of the NASDAQ100 vs S&P 500 with 5- and 21-day Exponential Moving Averages. (Source: StocksCharts.com)

1 The Standard and Poor’s 500 is an unmanaged, capitalization-weighted benchmark that tracks broad-based changes in the U.S. stock market. This index of 500 common stocks is comprised of 400 industrial, 20 transportation, 40 utility, and 40 financial companies representing major U.S. industry sectors. The index is calculated on a total return basis with dividends reinvested and is not available for direct investment.
2 Charts are for informational purposes only and are not intended to be a projection or prediction of current or future performance of any specific product. All financial products have an element of risk and may experience loss. Past performance is not indicative of future results.