
The last thing I was expecting this month was a nearly flat market. Sure, there have been some interesting ups and downs, but as I write this at the end of May, the S&P 500 is still where it was in early-February. There has been a lot of political drama around the US Debt Ceiling, but that historically isn’t really a market mover – at least not when it comes to major trends. What moves the market is the Federal Reserve, actual earnings of stocks, and the trend (direction) of the US Dollar.
There is a surprising amount of optimism out in the “Active Manager” communities right now, at least for the next few months or even quarters. Both at the CMT Symposium (Chartered Market Technicians) and at NAAIM Uncommon Knowledge (National Association of Active Investment Managers) the general opinion of the market trend was cautiously positive. Sure, there is always the possibility of unforeseen events, but barring that, the market could very well get back to new highs sometime this year.
Is the Federal Reserve done raising rates? That seems to be the opinion we’re seeing…for now. They claim to be keeping their options open to raise rates again, but it is likely that they are done for a while. There are even projections that interest rates could start to be lowered at the end of 2023. This is the kind of information that influences major trends, so we keep this at the forefront of our minds when thinking about market direction.
In the shorter-term, the US Dollar has been rising since the 2nd week of May. Usually this would indicate a falling stock market, but the market hasn’t sold off as it has in the past. For now, we’re finding that curious and wonder how this divergence will play out. It may feel counter-intuitive, but a falling dollar could be good for the stock market. So we’ll be on the lookout for that.
Our Shadowridge Long-Term Trend indicator is flirting with a positive reading, but it can’t quite seem to make that leap. It touched being positive for a couple of days last week, but has gone back to a very slightly negative trend.
Our Mid-Term Cycle signal is also negative and we’ve used that to lower stock market exposure. But it too has been on the edge of turning positive. Short-term readings are now looking very oversold, so a bounce looks possible for the next few days. This could be a good entry point for the next potential leg up.
As of Wednesday night (May 24th, 2023), our Shadowridge Dashboard showed Positive to Negative sectors as 3 to 8. Strength is largely in Technology and Communications (basically a Tech variation), along with Consumer Discretionary (think Amazon). However, a very large part of the market is not trending up with the big names. We saw this divergence in the 2nd half of 2021 when the market went up based on a small handful of stocks. But we know how that ended once we hit January 2022 (hint: it did not end well). We’re looking at the possibility of a replay, or a slight variation of that scenario that could play out through the rest of the year before turning ugly.
This month’s chart is a favorite of mine – the RRG (Relative Rotation Graph) of the 11 sectors of the S&P 500. Interesting to note that the 3 positive sectors I mentioned above are also in the “Leading” box on this chart. It’s great when different data types agree! But you can also see that most other sectors seem to be stuck in the “Lagging” box. And then there’s Energy (XLE), taking the long way around the pond but showing signs of improving.
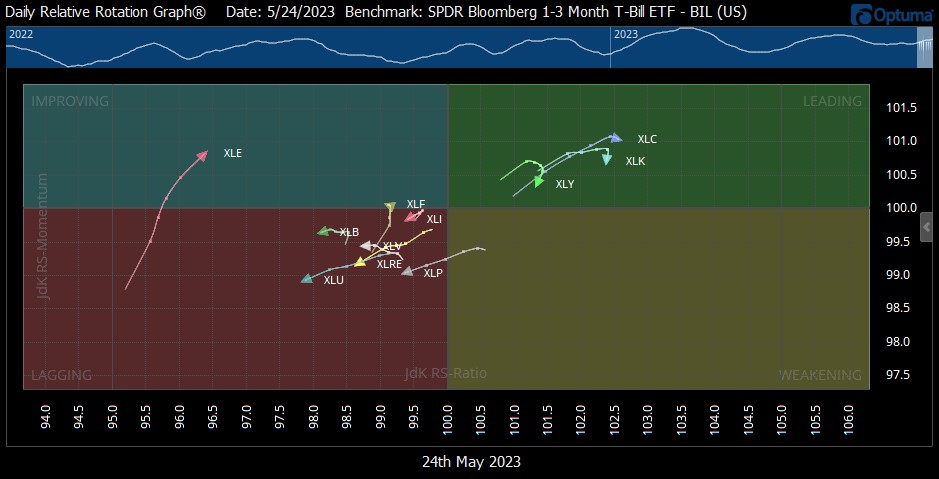
Five-day RRG Chart of the Eleven S&P 500 sectors. (Source: Optuma)

1 The Standard and Poor’s 500 is an unmanaged, capitalization-weighted benchmark that tracks broad-based changes in the U.S. stock market. This index of 500 common stocks is comprised of 400 industrial, 20 transportation, 40 utility, and 40 financial companies representing major U.S. industry sectors. The index is calculated on a total return basis with dividends reinvested and is not available for direct investment.
2 Charts are for informational purposes only and are not intended to be a projection or prediction of current or future performance of any specific product. All financial products have an element of risk and may experience loss. Past performance is not indicative of future results.