
Our expectations for April were higher than what reality gave us. Just as I was writing last month’s market commentary, things were starting to look up. Sector strength was improving. Money flow was turning positive. And seasonality factors suggested a reasonable outlook for a strong month. But what we got was a lot of “sideways chop”: a market that really didn’t go anywhere, beyond small ups and downs from where it started.
By our measure, the NASDAQ, which had been stronger than the S&P500 for several months, has now lost its relative strength. As I said on our April webinar, if you want to see growth stocks (and largely the NASDAQ) lead most of the other parts of the market, you want to see the growth area of the market acting the strongest. That’s not the case right now.
This week, we’ve also just seen the “Sell in May” signal suggest it’s time to call it good until sometime in October. That doesn’t mean that we won’t see good months over the summer, but historically, the bulk of index returns happen in the “Best Six Months” from November to April. And now we’re outside of that window.
Next week we’re expecting to see the Federal Reserve increase interest rates another 0.25%. Our belief is that this might be overkill at this point. Inflation has been coming down at a somewhat reasonable rate and the unemployment numbers haven’t spiked quite as high as we would have expected. But the decisions the Fed is making now are decisions that we won’t fully understand until months or even years from now. I hope they are making good choices.
Our Shadowridge Long-Term Trend indicator has gone back to being negative while being positive for most of the month (much like March did). At this point it isn’t suggesting any huge drop – it is mostly just a point of interest to keep an eye on. We’ve already gotten defensive in our models by at least half over the past week. Any further weakness and we go to lockdown (cash/money market or market neutral, depending on the strategy).
Our Mid-Term Cycle signal went back to negative on April 22nd, so we used that signal to start chopping down our market exposure. If the cycle continues, this would suggest we may see another 4 to 6 weeks of sideways “chop,” or a sell-off. These cycles have been consistent since Q3 of last year and seem to be acting “normal” (yes this is normal).
As of Wednesday night (April 26th, 2023), our Shadowridge Dashboard showed Positive to Negative sectors as 1 to 10. Only Consumer Staples are holding on to their positive momentum. This is another factor that suggests we need to ease back on market exposure.
This month’s chart is of the S&P 500 since the beginning of 2022. The major trendline in Red shows how each market rebound so far this year has had a tendency to hit that line and reverse. But now we are above it, so in theory, as long as the index doesn’t go back below the March lows, we believe a bigger positive trend is in place and each dip now creates new opportunities to buy (or add) to equity holdings. I mentioned recently reducing our exposure. Using this chart, you should be able to visualize when and where we’d be looking to get back into the market in the few weeks’ time.
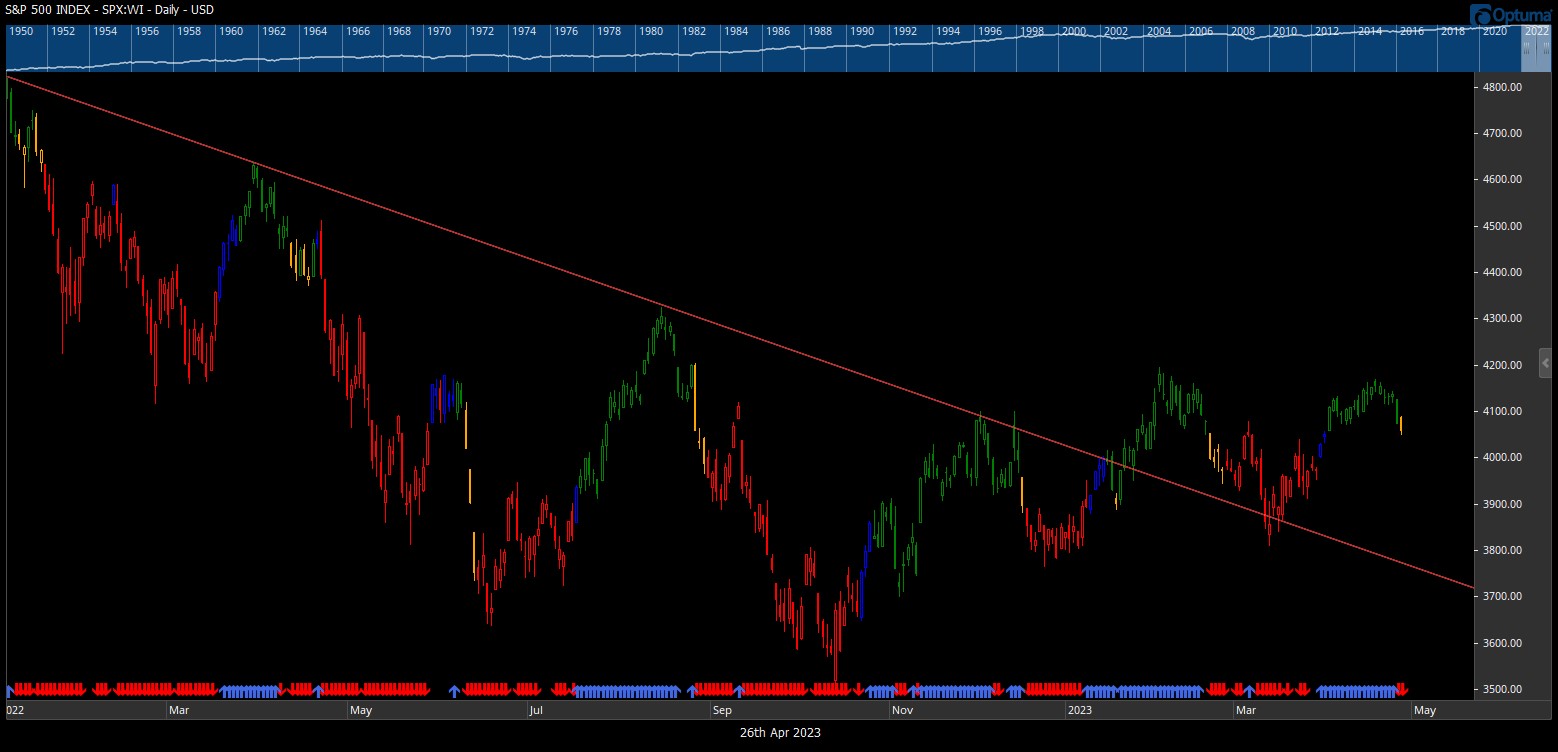
Sixteen Month chart of the S&P 500 with major trend line. (Source: Optuma)
Last month we observed that the Bond market was a mess, and this month has been no different. While both the Aggregate Bond Index (AGG) and the 10 Year Treasury Index (IEF) are now up between to 3.5 to 4.5% YTD, that hasn’t been without some swings. There have been many false signals and fake-outs in those areas. We’re still not confident enough in the interest rate situation to be all-in on bonds. That might still last for quite some time. There are opportunities, but to us, they remain on the short-duration side where less risk resides.
Bottom Line: We’ve done well catching parts of the market up-swings while largely avoiding the downdrafts so far this year, and right now is no different. If the cycles we have seen continue, now is the time to back off on market risk, hold on to the gains made, and be ready for the next up-cycle to occur in the next few weeks. And I’m looking forward to that!

By the way, I wrote this newsletter from NYC, where I am attending the Certified Market Technicians conference. I am continually fascinated by the things I learn at conferences. Excited to bring these ideas to our clients!

1 The Standard and Poor’s 500 is an unmanaged, capitalization-weighted benchmark that tracks broad-based changes in the U.S. stock market. This index of 500 common stocks is comprised of 400 industrial, 20 transportation, 40 utility, and 40 financial companies representing major U.S. industry sectors. The index is calculated on a total return basis with dividends reinvested and is not available for direct investment.
2 Charts are for informational purposes only and are not intended to be a projection or prediction of current or future performance of any specific product. All financial products have an element of risk and may experience loss. Past performance is not indicative of future results.