
After a solid start to the year and positive results in the stock and bond markets in January, February hasn’t fared as well. Both the S&P 500 and the NASDAQ 100 peaked on February 2nd and have been making a slow and wandering move downwards ever since. In fact, most investors didn’t seem to notice until the decline started to (only slightly) accelerate around the 15th of the month.
There are a couple of ratios that we follow that suggest we could see more up-side in the next few months. Both the Growth to Value stock ratio and the NASDAQ to S&P500 ratios are leaning towards Growth and NASDAQ. Rob Hanna of Quantifiable Edges has done some great work on the NASDAQ/S&P500 ratio if you want to read further.
Beyond the ratios, Seasonality is worth keeping in mind when thinking about how to invest. This month’s chart (below) will go into more detail, but so far this year, January and February have played out as expected and the next few months are seasonally strong.
So what could go wrong? There are always a handful of datapoints that point to eminent doom. The most prominent right now are concerns over eventual war with Russia, or even China. And these are valid reasons to be concerned. However, those reasons don’t always come to a head and even if they do, that doesn’t always lead to a bad stock market.
Other negative factors include: The Federal Reserve is still raising interest rates and will likely do that another 2 or 3 times this year. There is an old saying “Don’t fight the Fed” that largely pertains to being too aggressively invested while they are raising rates. In other words, when interest rates are going up, the stock market tends to go down. Don’t forget that the Fed still needs unemployment to rise. And indeed, we are seeing a lot of layoffs across many sectors of the market – they just aren’t being reflected in the government data…yet.
And finally (I’m stopping at three), we still have an inverted yield curve. I know I keep hounding on this, but it is an indicator of a pending recession in the next 12 to 18 months that is worth noting. We’re keeping our eye on this.
But in the near term, we’re seeing plenty of positives. Seasonally, the 3rd year of a presidential cycle is the strongest. We also currently have the mixed government needed for the best historical outcome. Does that mean it will happen this time? Not necessarily. But history does seem to repeat in some form or another.
Our Shadowridge Long-Term Trend indicator has remained positive so far this month, even with the slow sell-off going on in the market. It had been stretched last month, so if it can remain positive while shorter term indicators turn back to positive (see below), then we could have a good run up in March and April – just as Seasonality would suggest.
Our Mid-Term Cycle signal went negative on February 8th. At that time, we cut most of our stock market exposure in half, so we’ve been at a reduced posture since then, just in case the downside movement were to accelerate. This indicator has now gotten stretched to the over-sold side and a bounce in money flow could mean a few good days going into the end of February.
When the market has rebound days, then that is what is likely to move the most. We’ve also started to scale out of our Large Cap Value holdings we had for much of 2022. I’m not sure they will offer the same buffer they did going forward. At least, not as long as Growth is leading in strength.
As of Wednesday night (February 22nd, 2023), our Shadowridge Dashboard showed Positive to Negative sectors as 4 to 7. Technology and Communications are still positive since last month, but are now joined by Consumer Staples and Consumer Discretionary. That is an odd mix of leadership. But we also note that the RRG (Relative Rotation Graph) of the sectors has been looking very chaotic lately. You can see those graphs posted weekly on my Twitter feed.
For this month’s chart, let’s look at the Seasonality of the S&P 500. The chart below shows the average return of the S&P 500 for each month of the year, from 1950 to 2023. January is normally positive and February is usually negative, if only just a little bit. March and April (and even May) tend to be a good time for the index. It is when we get to the summer and fall that it gets less consistent. We saw this play out last year – October and November 2022 were indeed positive. However, the outlier was December 2022, where the index was down.
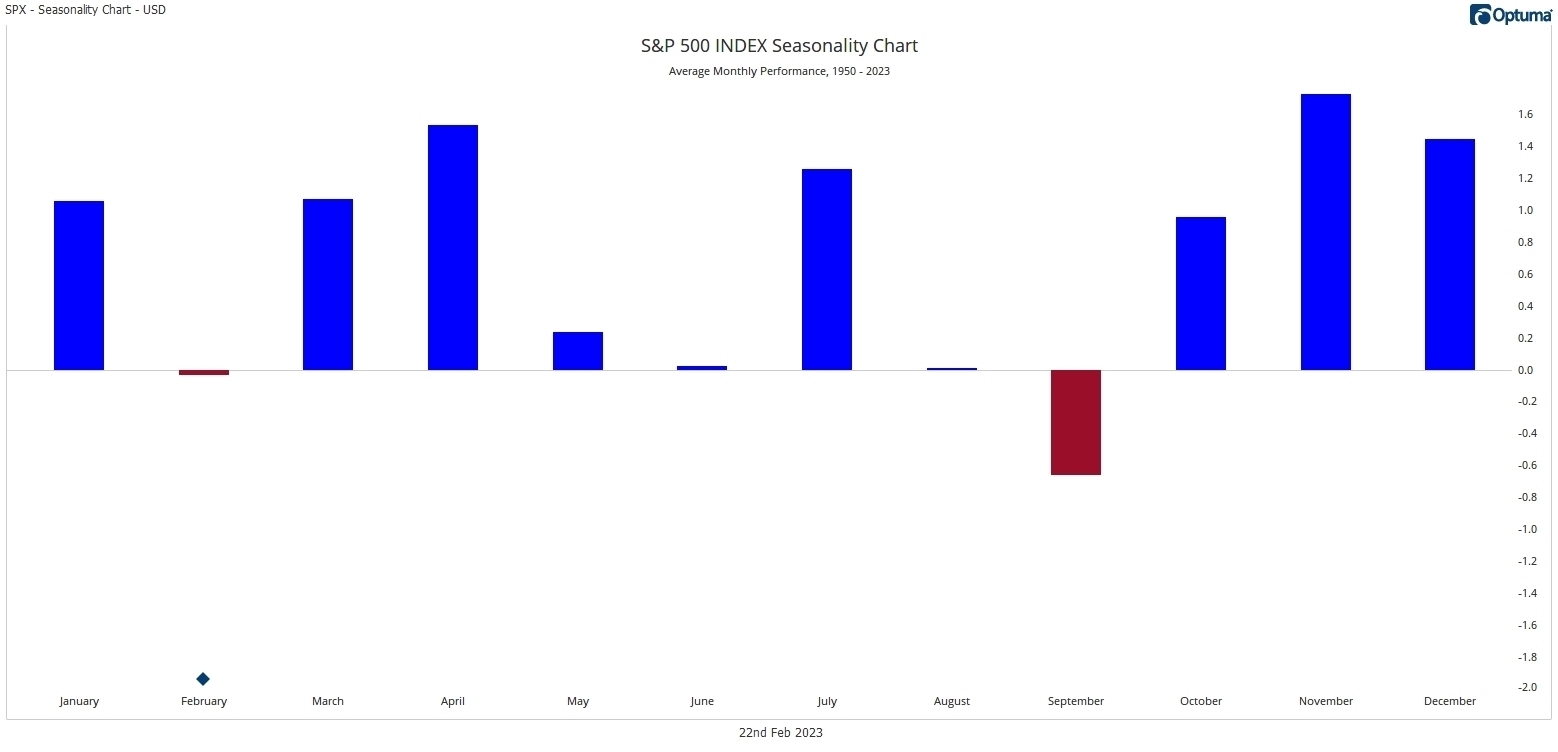
Seasonality of the S&P 500 From 1950 to 2023 (Source: Optuma)

1 The Standard and Poor’s 500 is an unmanaged, capitalization-weighted benchmark that tracks broad-based changes in the U.S. stock market. This index of 500 common stocks is comprised of 400 industrial, 20 transportation, 40 utility, and 40 financial companies representing major U.S. industry sectors. The index is calculated on a total return basis with dividends reinvested and is not available for direct investment.
2 Charts are for informational purposes only and are not intended to be a projection or prediction of current or future performance of any specific product. All financial products have an element of risk and may experience loss. Past performance is not indicative of future results.