
Happy New Year! Since I was born in the year of the Rabbit, I’m excited about what is possible. And since the Rabbit is a symbol of peace and prosperity, I like what that means for 2023.
After a slow start to January, the stock market seems to share my optimism for the year ahead. The most interesting twist or change from the prior year is that the NASDAQ / Growth stocks are starting to look stronger than the S&P500 / Value stocks side of the market. If that continues to hold, we view that as a positive environment for the near, and hopefully extended, future!
So what could go wrong? Well, there is a large consensus among “experts” that a global recession is still on the horizon. And that is possible. But recessions are funny things. The markets do not always react in the ways that “experts” think they will. It has been our belief that we were indeed in a recession in 2022, even though that wasn’t “officially” declared. If we actually were or weren’t in a recession really isn’t as important as how we reacted to situation. Since our decisions aren’t driven by what the “experts” say, we will find opportunities either way.
What we haven’t seen yet that often comes with an actual market bottom is when investors give up completely. Investors don’t seem to have gotten to that point yet. But interestingly, advisors might have. The NAAIM Exposure Index showed an advisor sentiment at the end of September that hadn’t been as low since the bottom of the Covid crash in 2020. So maybe advisor sentiment, rather than investor sentiment, was the wash-out situation we were watching for. It does seem to align with when the market hit the low of 2022. (Full disclosure – both Will Hepburn and myself are data points included in the NAAIM exposure index.)
The other factor that we were lucky to have a break from this month is that there are no Federal Reserve meeting or updates coming out until early February. “Don’t fight the Fed” is a popular phrase worth heeding, but thankfully we don’t have to think about them for at least a little while longer.
Our Shadowridge Long-Term Trend indicator has been surprisingly resilient so far this month. The indicator is currently positive, though it might be getting a little bit stretched at this point. That doesn’t mean we can’t still go up, it just suggests there might be some resistance in the near future and that easy gains might be behind us for now.
Our Mid-Term Cycle signal has been positive since January 4th. This pushed us back into the market in many of our models, or at least more than we were in December, when things were more volatile. The strength seems to be holding up for now, but like our Long-Term indicator, we feel it could be getting stretched a bit to the upside in the near term.
As of Thursday night (January 26th, 2023), our Shadowridge Dashboard showed Positive to Negative sectors as 8 to 3. The current strength and weakness among market sectors is almost completely opposite to where they were last month. Right now, Technology, Communications, and Financials are strongest, while HealthCare, Utilities, and Consumer Staples are lagging. The last three are usually strong when investors need to be defensive, so that builds the case for the move upwards we are currently experiencing.
For this month’s chart, I want to look at the 11 sectors of the S&P 500 in a Relative Rotation Graph. I post these weekly to my Twitter feed for those who want to keep up on the rotation. What the graph is showing is each sector relative to Treasury Bills (BIL) and the path they’ve taken over the past week (5 days). This week, in the bottom left “Lagging” quadrant, you can see the three weak sectors I mentioned above (XLV – Healthcare, XLU – Utilities, and XLP – Consumer Staples). All others are in the green “Leading” box for now, which is a good sign. But seeing many arrows pointing down suggests possible trouble ahead. However, they can also abruptly bounce back up and to the right.
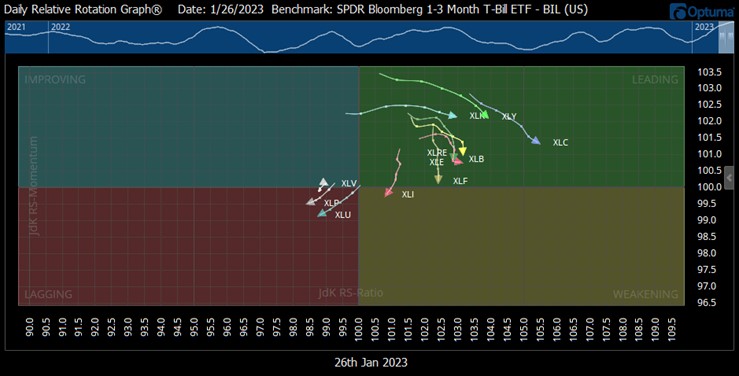
Market sectors of the S&P 500 Relative Rotation Graph vs T-Bills (Source: Optuma)
Bonds had a surprisingly ugly year in 2022 and no part of that market was spared. From the core Aggregate Index, to lower-risk US Treasuries, to equity-like High Yield bonds – none of them were safe from a bad year, being down between 11% and 15%. That is exceptionally bad for what is usually thought of as a safety asset (or at least a diversifier). Owning bonds did very little to offset investors’ risk last year.
Possibly the most underestimated thing we do here at Shadowridge is manage 3 bond models: our Income Model (based on the Aggregate Bond Index), our High Yield model, and our Municipal Bond model. All of them experienced losses of less than half of their respective benchmarks in 2022. And while we recognize that the bond market isn’t particularly exciting, navigating it is one of our strong points, which lower-risk investors (like those in retirement) especially benefit from.
One aspect we’ve added to all of our modeling as a result of the volatility in 2022 is analyzing and rating the status of a benchmark index that a model might want to emulate. If the index (stock, bond, etc.) is showing strength, then we should be firmly invested in that model. And if any of the indexes are showing weakness, then there is little reason for us to hold too much exposure relating to that index. So far, that philosophy has helped us to be on the right side of the market more quickly, whether that means being fully invested or playing it safe.
Bottom Line: We are looking forward to a positive 2023, no matter what the market environment brings us. We used 2022 as a way to reassess how we look at market risk and as a result, we feel better prepared for both the good and the bad of whatever comes in the future. And, of course, the year of the rabbit is “my” year!
As always, stay safe out there!! …and again, Happy New Year!! ![]()

1 The Standard and Poor’s 500 is an unmanaged, capitalization-weighted benchmark that tracks broad-based changes in the U.S. stock market. This index of 500 common stocks is comprised of 400 industrial, 20 transportation, 40 utility, and 40 financial companies representing major U.S. industry sectors. The index is calculated on a total return basis with dividends reinvested and is not available for direct investment.
2 Charts are for informational purposes only and are not intended to be a projection or prediction of current or future performance of any specific product. All financial products have an element of risk and may experience loss. Past performance is not indicative of future results.