
It’s “Santa Clause Rally” time and Santa is nowhere in sight! Historically, the last 5 trading days of December and the first two trading days of January are when that “rally” is supposed to happen. But this year, it looks like we (the collective “we”) are on the “naughty” list.
While October and November looked promising that we had seen the bottom for the year, as December 1st rolled around, the markets decided that was not the case. Early December was a high point in most US stock markets and we’ve been grinding downwards ever since. As we said last month, the volatility we are still seeing (mostly around Federal Reserve announcements) isn’t typical for a new “bull market.”
What we haven’t seen yet is the general public giving up on the stock market. That negative sentiment often coincides with a steep sell-off that marks a cycle bottom. When we start to hear investors say things like “if the market goes down again, get me out!” – then we know those are famous last words before money shifts and the tide turns again.
Earlier this month, the Fed only raised interest rates by 0.50%. While that is still a large increase compared to most other rate hikes in history, it was less than what was expected. This created a rather large jump up in the market that only lasted a few hours. While the Fed is becoming less aggressive, a raising rate environment is still a headwind to the stock market. The saying “Don’t fight the Fed” is an old adage that describes this phenomenon and where we are in that cycle.
We still think it is likely that 2023 could be a good year for stocks – just maybe not the ones that got us here. Growth and Technology have long been the leaders, but now these sectors are looking weak relative to the Value side of the market. That appears to be a more macro theme that we’ll need to keep in mind in the near future.
Our Shadowridge Long-Term Trend indicator has shown a weak market, even when it should be showing strength. The indicator is currently Negative. Our Mid-Term Cycle signal has been Negative since early December. Just as we nudged back into the market on strength when it turned positive, we’ve now nudged back out on this weakness and currently have very little exposure to stock market risk.
As of Wednesday night (December 28th, 2022), our Shadowridge Dashboard showed Positive to Negative sectors as 3 to 8. Energy might be leading the charge of strength after falling off the most recently. Technology and Consumer Discretionary appear to be the weakest at the moment. However, the sectors holding up most are the “Value” sectors: Consumer Staples, Utilities, and Healthcare.
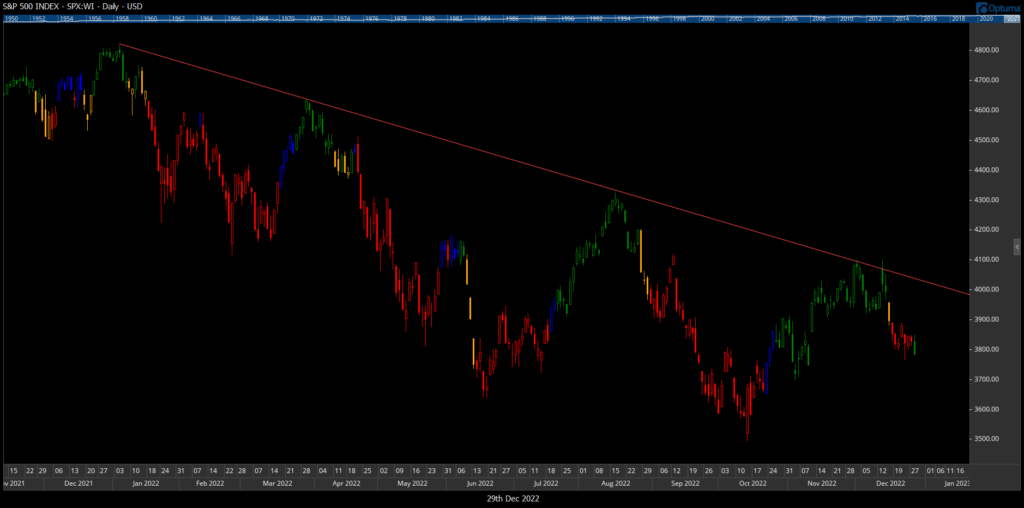
For this month’s chart, I want to look at the S&P 500 over the year 2022. It’s remarkable how much symmetry there is in the chart. There were 3 large rebounds between +10% and +16% spaced out approximately 3 months apart. Each rebound stopped right at the trendline off the previous swing high. This speaks to the higher volatility we see in “bear” markets vs the much lower volatility and movement of “bull” markets. Also, a break above this trendline could mean the market direction is finally changing.
Bonds – as of this writing, the Aggregate Bond Index AGG is down -12.94% YTD in 2022. The 7–10-year Treasury bond index is down -15.22% this year (FastTrack Data). This has been one of the worst years for the bond market in many decades. The cold comfort for bond holders is, what looked like a year where bonds would be down more than stocks, doesn’t look like that will be the case now.
As of December 28th, the S&P 500 will likely have a -20% return for the year and the Nasdaq 100 will have around a -34% loss this year (unless a huge jump occurs on the last 2 trading days of the year). Ouch.
Bottom Line: We’re still looking at 2023, as the 3rd year of the presidential cycle, to have positive tailwinds. But that could happen after a big wash-out of individual investors. If that is how the first quarter of 2023 plays out, we’d be preparing for a strong run up from there. But as always, we’ll keep market risk low until we see those signs.
As always, stay safe out there!! Hoping for a prosperous and Happy New Year!!

1 The Standard and Poor’s 500 is an unmanaged, capitalization-weighted benchmark that tracks broad-based changes in the U.S. stock market. This index of 500 common stocks is comprised of 400 industrial, 20 transportation, 40 utility, and 40 financial companies representing major U.S. industry sectors. The index is calculated on a total return basis with dividends reinvested and is not available for direct investment.
2 Charts are for informational purposes only and are not intended to be a projection or prediction of current or future performance of any specific product. All financial products have an element of risk and may experience loss. Past performance is not indicative of future results.