
The stock market environment might really be improving this time, but there are still a few barriers that need to be overcome. Even the bond market is acting better than it has all year.
Since bottoming in early October, the major US stock market indexes have been mostly up, but not without some volatile days along the way. Both the S&P 500 and NASDAQ 100 had single days recently that were up over 5%. And while that sounds great, that is usually not “bull market” activity. Generally, the stock market has those kinds of UP-days during bear markets. Furthermore, these strong UP-days tend to cluster during the most volatile periods of bear markets.
The bond market bottomed later in October, but so far is showing strength we haven’t seen since early summer this year. I’ve spoken with several bond fund managers over the past couple of months and they all see a lot of “baked-in” upside across most bond market categories. This is mostly from how high yields are compared to their maturity dates. As bonds mature, as long as they don’t default, they will end at “par” value. And so many bonds are far, far below their par values that this is an attractive setup for them to rise in value into their expiration dates, especially in the shorter time frames.
Now that the Fed has announced they will be slowing their aggressive stance on raising rates, after the most aggressive period we’ve seen in recent history. As we’ve been saying for months, the Fed has wanted to see unemployment numbers start to rise. In the Tech sector specifically, those numbers are absolutely on the rise, and seem to be increasing every day. So now that this number is rising, there might be less of a need to be so aggressive in raising rates. The prior expected increase for December was another 0.75%, but projections are now suggesting that number could be lower.
These developments could very well be the catalyst for the stock market to finally take a break from going down. And as we showed in our Market Commentary video this month, where we are based on the election cycle and the outcomes has historically been favorable.
So with all this good news, what’s the bad news? Well, the yield curve is still inverted, which is a historic 12–18-month precursor to a recession. This indicates that if what we just went through wasn’t a recession, another could be along shortly. But for now, we likely have some time before those market storms continue.
Our Shadowridge Long-Term Trend has been struggling to stay positive, but for now, it is holding. Our Mid-Term Cycle signal is now positive and showing stronger numbers after weakening over the past week or so. Based on this renewed positive data, we’ve been nudging money back into the market as it seems reasonable.
As of Wednesday night (November 23rd, 2022), our Shadowridge Dashboard showed Positive to Negative sectors as 11 to 0. Financials and Industrials are both holding their strength as they were last month. Energy might now be where the weakness is after a really good run up over the past month or so.
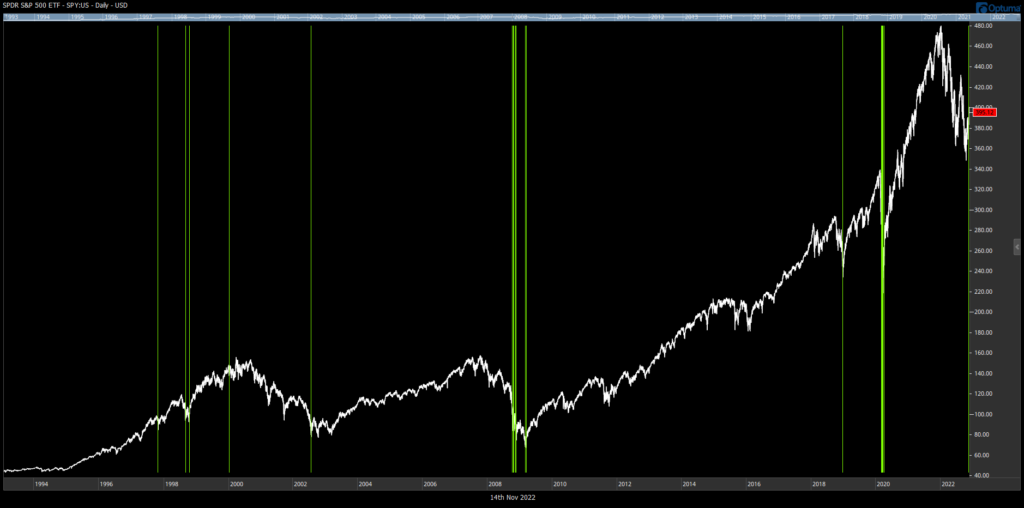
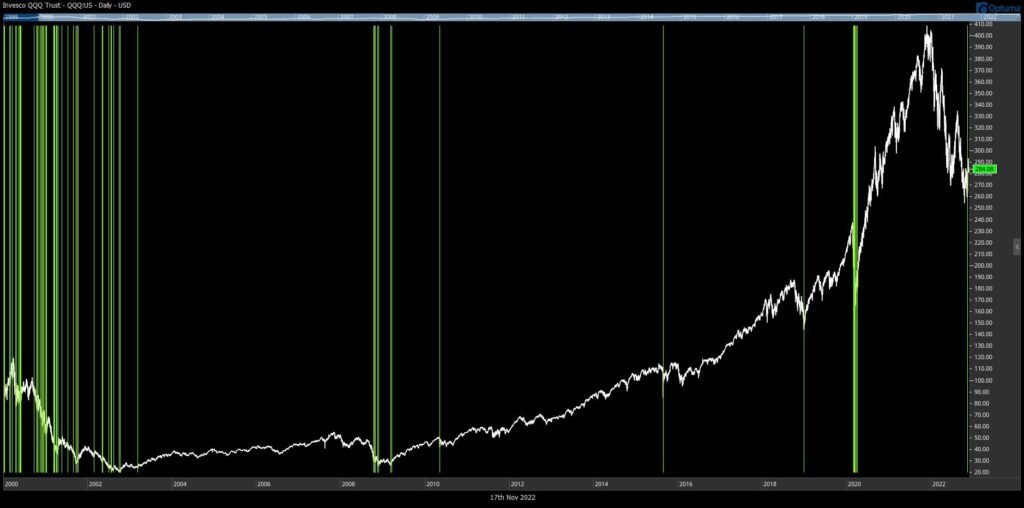
For this month’s chart(s) I want to show where the big UP days in the market have occurred. The first chart is of the S&P 500 since 2000. There is a green line every day that the index was up more than 5%. The second chart is the same, but with the NASDAQ 100.
There are two things that grab my attention in these charts. First, the majority of days that are up 5% or more tend to happen in bear markets. When the markets were in “bull” status (from 2003 to 2007 and from 2009 to 2019), there are almost zero days with this much upside. Secondly, when “bear” markets are near their end, there tends to be a cluster of several big up and down days of this magnitude.
Bonds – as of this writing, the Aggregate Bond Index AGG is down -12.50% YTD in 2022. The 7–10-year Treasury bond index is -14.29% this year (FastTrack Data). As we mentioned earlier, a few of the bond markets are having a decent move off of their lows in late October. However, the broad bond indexes are still down much more than usual and are still off nearly as much as the stock market so far this year.
Bottom Line: Last month we said bonds could have a worse year than stocks, and we are starting to see how that could play out through the end of the year. Seasonally, this is a good part of the year for the stock market to move up on holiday cheer. And the change in US government control should (in theory, at least historically) be a positive for the stock markets for the next little while. But never forget that at some point, all that could be wrecked by a recession wave. We’ll continue to watch the data closely and adapt to the changing markets in our portfolios as prudent.
As always, stay safe out there!! Hope you have a great Thanksgiving!!

1 The Standard and Poor’s 500 is an unmanaged, capitalization-weighted benchmark that tracks broad-based changes in the U.S. stock market. This index of 500 common stocks is comprised of 400 industrial, 20 transportation, 40 utility, and 40 financial companies representing major U.S. industry sectors. The index is calculated on a total return basis with dividends reinvested and is not available for direct investment.
2 Charts are for informational purposes only and are not intended to be a projection or prediction of current or future performance of any specific product. All financial products have an element of risk and may experience loss. Past performance is not indicative of future results.