
We were expecting volatility to pick up in August, but that hasn’t really happened. After a quick drop at the end of July, most broad indexes marched higher – at least until the middle of the month. After that, I think the market took a vacation and largely went sideways from there.
There was a brief pop in the market on the news that the Federal Reserve might finally cut interest rates in September, but that lasted one day and then it was back to doing nothing. It does seem that a lot of trade desks are on holiday these past couple of weeks. So what happens when everyone gets back?
The seasonal tendency is for August and September to have the lowest odds of a positive month. And when August holds up, September swings can get much bigger. While nothing has to happen as expected, and rarely does, this is notable. If we start to see that scenario play out, we’ll expect to get much more defensive than in a highly positive month or period of the year.
If there is one interesting shift that we’re starting to see play out, it’s that the strength of the tech sector, relative to other sectors, appears to be weakening. Tech and NASDAQ tend to lead in strong markets and when they fall out of leadership, the market’s strength can be muted. Or it can be a heads-up that weakness is around the corner.
This month’s chart is a re-visit of the NYSE New Lows chart I shared a couple of months ago. It gives a good gauge of whether something is wrong underneath the surface of the market. A higher reading means more stocks are hitting new 52-week lows. And as more hit that level, the market tends to be under pressure. For now, the current count is 3. Single digits is a quiet market without much fear going on. This is another factor we watch daily to see if we need to be more defensive in the coming months.
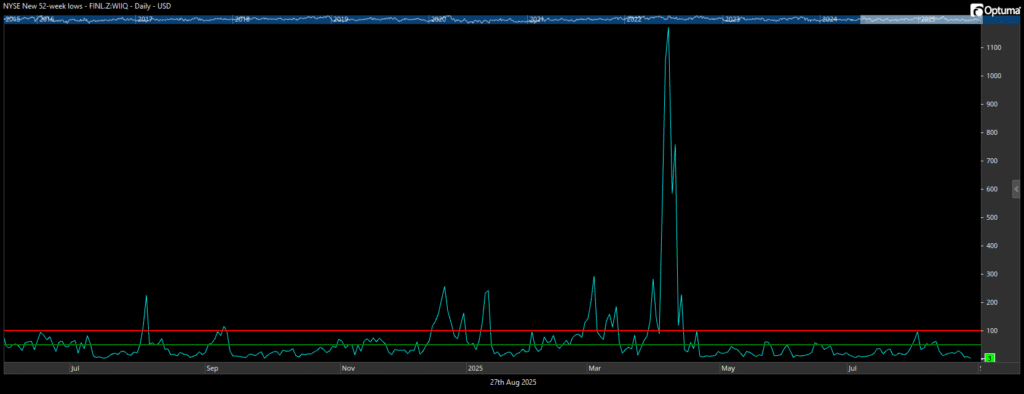
One-year NYSE New Lows with price levels at 50 and 100 (Source: Optuma.com)
Our Shadowridge Long-Term Trend indicator remains positive since April 24th and continues to steadily move higher. This is another factor that gives us context about market trend. And, for now, everything looks ok.
Our Mid-Term Cycle indicator went back to positive after the quick end-of-July sell-off (August 5th, 2025) but there isn’t a lot of strength in this “money flow” indicator. While being positive is nice, it’s also helpful to see it move upward. But it’s just been sideways for a few weeks now.
As of Wednesday night (August 27th, 2025), our Shadowridge Dashboard showed Positive to Negative market sectors as 9 to 2. Interesting to see the two weak sectors as Technology and Utilities. That is a mixed message that we’ll have to watch for any new shifts in sentiment.
Right now, 9 RGB Bond Indexes are trending positive, above their 50-day Moving Averages. The weak bond sector now is the High Yield Muni index. This sector has struggled the most this year, while the entire “Economic” sensitive bond sectors have been consistently strong.
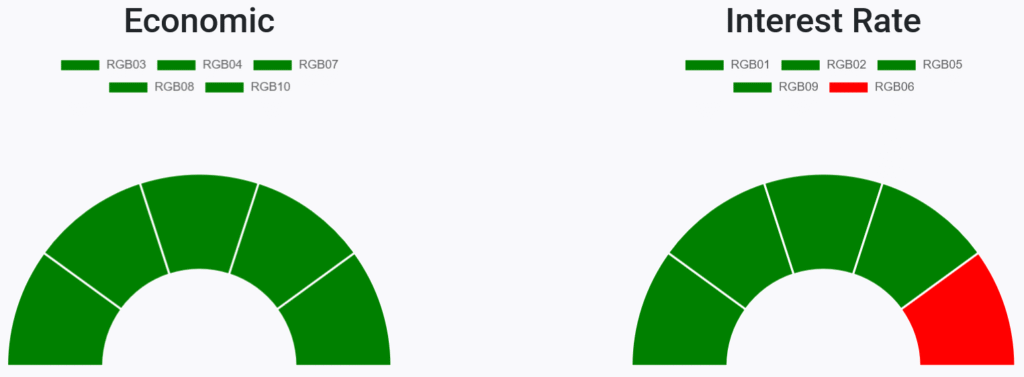
RGB Economic and Interest Rate Sensitive Bond sectors (Source: ShadowridgeData.com)
Bond sectors have remained mixed this year. We still favor Bank Loan and High Yield Corporates over most other areas of the Bond market. These are both in the Economic side, so they’ve been steadier – and that’s what we look for when adding bonds as a diversifier or stabilizer to a portfolio. However, if interest rates do start getting cut, the interest rate sensitive side should start doing well – something we’re also watching as we head into the next few Fed meetings.
Bottom Line: August was more resilient than seasonality would have suggested, but when August is steady, September can surprise us with a shift into a higher volatility market. And that is usually not a positive shift. But we’ll be keeping an eye on our factors and if we see any signs of trouble, we’ll be reducing our market exposure. For now, things look good, but we’ll be watching what happens in September, when sentiment can turn on a dime.
Stay safe out there!

1 The Standard and Poor’s 500 is an unmanaged, capitalization-weighted benchmark that tracks broad-based changes in the U.S. stock market. This index of 500 common stocks is comprised of 400 industrial, 20 transportation, 40 utility, and 40 financial companies representing major U.S. industry sectors. The index is calculated on a total return basis with dividends reinvested and is not available for direct investment.
2 Charts are for informational purposes only and are not intended to be a projection or prediction of current or future performance of any specific product. All financial products have an element of risk and may experience loss. Past performance is not indicative of future results.