
Contrary to market norms and general expectations, September has been surprisingly quiet, with no signs of market volatility. As of this writing (9/24/25), we’re halfway through what is typically the worst week of the entire year, but we’re only seeing very mild negativity. This week, we’ve only seen about a 1% drawdown so far. For now, that is nothing to be concerned about. The market just wants to go up, so there is no reason to fight it.
As I’ve said many times, the seasonality factors are an excellent roadmap as to where the market tends to go at certain points during the year. Where the magic happens is when market trends start to agree with seasonality. So far, we don’t have an agreement, giving us little reason to reduce market exposure in our models. And truly, there hasn’t been much to adjust since the market recovered from the “tariff tantrum” in April this year. With seasonality still suggesting we’re in a sketchy spot, we’ll be at the ready to make adjustments if that time comes. Until then, we’ll keep riding this wave.
The Federal Reserve did cut interest rates by -0.25% as expected, but the market’s reaction wasn’t much more than a yawn. There is now the expectation of 2 more rate cuts by the end of 2025, but that may be a bit ambitious. However, if you follow the relationship of the Fed’s Target Rate and the 2-year treasury yield, then yes, they are behind by about that much.
Earlier this month, I was on the “Money Life” podcast for a quick update on what I’m seeing the market. While there is a lot of buzz about small caps and international stocks, I’m not finding much of a reason to go chasing those trends. The S&P 500 and the NASDAQ 100 are working just fine. It was great to get to know Chuck Jaffe, who has been reporting on the markets for decades.
This month’s chart is a look at when the Money Flow Index (MFI) spikes above 80 on the S&P 500 ETF (SPY). Numbers this high tend to suggest exhaustion and a likelihood of the market peaking or at least slowing from this point. I find these spikes a great starting point to consider trimming gains made from stock market exposure and move those proceeds to a safer side of a portfolio. If someone is taking income in retirement from their investments, this is worth exploring to help fill that income bucket (we’ve already done this for our clients).
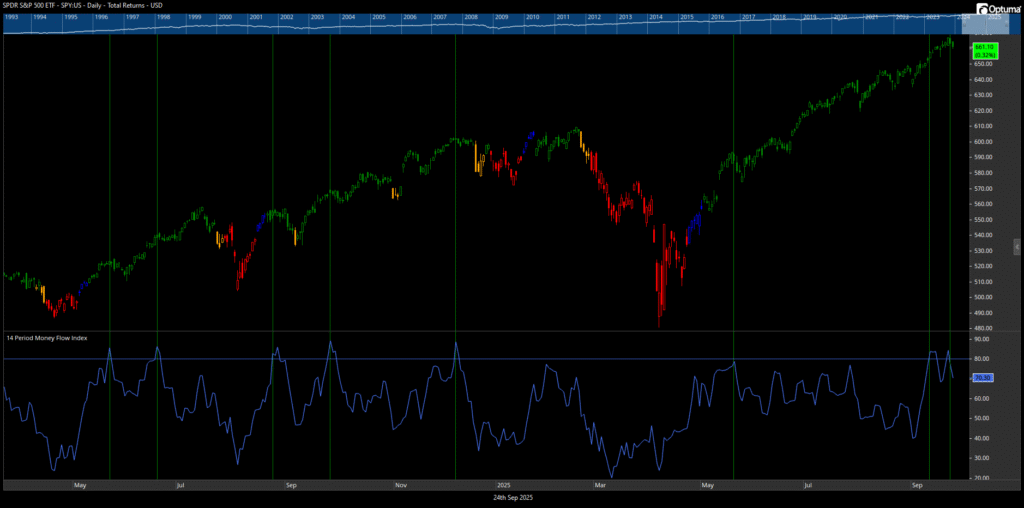
One-year S&P 500 (SPY ETF) with Money Flow Index (MFI) (Source: Optuma.com)
Our Shadowridge Long-Term Trend indicator remains positive since April 24th and continues to trend higher. However, it is now close to testing its first line in the sand where we’d start considering playing defense.
Our Mid-Term Cycle indicator is again negative since September 16th, but there isn’t much other data saying there is trouble. At least not yet. I’m not counting out seasonal weakness until we get to the end of October.
As of Wednesday night (September 24th, 2025), our Shadowridge Dashboard showed Positive to Negative market sectors as 8 to 3. The weak sectors are Materials, Healthcare, and Consumer Staples. So all the growth names are sitting on the positive side of the ledger. Another factor that suggests the market isn’t too fearful.
Right now, all 10 RGB Bond Indexes are trending positive, above their 50-day Moving Averages. But while this looks good right now, several interest-rate-sensitive bond sectors have been drifting lower since the Fed cut interest rates. Which is the opposite of what you’d expect to happen. When rates fall, bond prices rise.
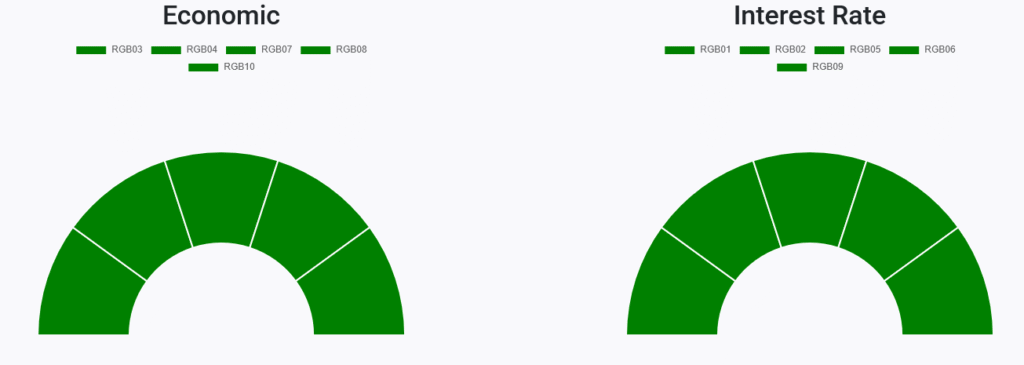
RGB Economic and Interest Rate Sensitive Bond sectors (Source: ShadowridgeData.com)
Bond sectors have been more relevant recently than they have been in a few years. We still favor Bank Loan and High Yield Corporates over most other areas of the Bond market. Our expectation was that a Fed rate cut would (in theory) help the Interest Rate sensitive bonds, but so far that just isn’t what we are seeing. This also happened the last time rates were cut. So maybe this is the “new normal” in the bond world.
Bottom Line: We’re still not seeing the volatility normally associated with the month of September, so we’ve had little reason to reduce any stock market exposure other than trimming back some gains. But we’re not out of the woods yet and still have to get through October. While we’re at the ready to play defense, the market just doesn’t want to go down right now. So we’ll stick with following that trend until it changes.
Stay safe out there!

1 The Standard and Poor’s 500 is an unmanaged, capitalization-weighted benchmark that tracks broad-based changes in the U.S. stock market. This index of 500 common stocks is comprised of 400 industrial, 20 transportation, 40 utility, and 40 financial companies representing major U.S. industry sectors. The index is calculated on a total return basis with dividends reinvested and is not available for direct investment.
2 Charts are for informational purposes only and are not intended to be a projection or prediction of current or future performance of any specific product. All financial products have an element of risk and may experience loss. Past performance is not indicative of future results.