
While October hasn’t been as “scary” as it could have been, the S&P 500 did manage a very quick -2.98% drawdown in two days (Oct 9th & 10th). But this pullback gave us an opportunity to add stock market exposure in a couple of models where we were looking to increase exposure or just get new money working. It turned out to work well for that need.
Looking at seasonality, the market hasn’t followed the larger pullbacks expected during these past 3 “worst months” of the year: July, August, & September. While it would have been nice to get more opportunities to get aggressive over this period, we were allocated enough to enjoy the ride.
Now that we’re into three of the best months of the year for the major stock market indexes, we’re not seeing much of a reason to go on defense. Any news items that could shake the market have largely been ignored, or only created volatility for a few hours, before the stock market has continued its march forward.
The Federal Reserve did again cut interest rates by -0.25% as expected this week, and again, the market’s reaction was minimal. On some Fed days, for example, the market has experienced swings of 2% or more in both directions before figuring out what’s next. This week wasn’t anywhere near that much movement. And for now, the trend is up, so we’d expect that to continue over the next few months.
This month’s chart is a look at the Volatility Index (VIX) over the past year. I think this illustrates how short lived the fear was earlier in October. Around the middle of the month there was a very short-lived volatility spike that corresponded with the market’s brief pullback period. Seeing this index pull back so swiftly suggested the correction to be short lived, which it turned out to be. Longer term spikes, like what we saw in April, correspond to bigger dips in the market. But even then, you can get a sense of when market fears are subsiding, giving way for the market to start going up again.

One-year Volatility Index (VIX) with price level at 22.5 (Source: StockCharts.com)
Our Shadowridge Long-Term Trend indicator had a steep and swift pullback into risk-off territory, but it only lasted for one day. That dip corresponded with the Oct 10th market dip. But our data recovered quickly the next day, suggesting that risk-on was still the place to be.
Our Mid-Term Cycle indicator also turned positive just after this same pullback and has remained positive since then.
As of Wednesday night (October 29th, 2025), our Shadowridge Dashboard showed Positive to Negative market sectors as 6 to 5. The weak sectors are largely made up of defensives, which are another indication that there is still strength in this market.
Right now, all 10 RGB Bond Indexes are trending positive, above their 50-day Moving Averages. Strength has just turned back towards the Economically sensitive bond sectors after the Interest Rate side had been leading for the first half of October.
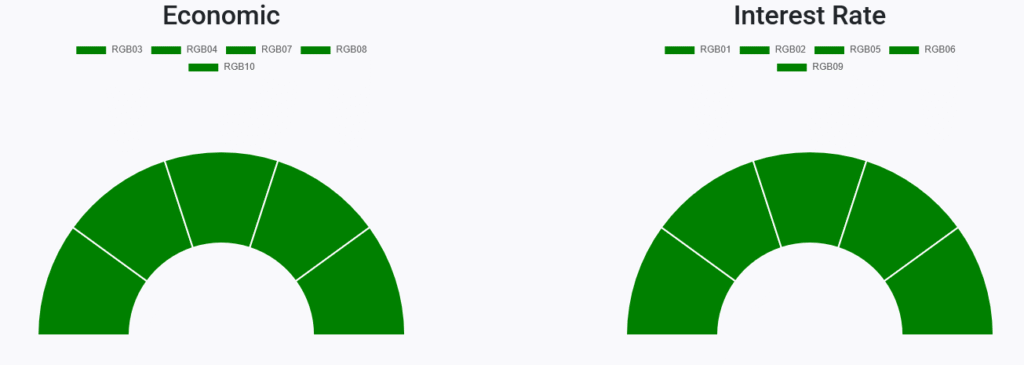
RGB Economic and Interest Rate Sensitive Bond sectors (Source: ShadowridgeData.com)
Bond sectors continue to grind upward, though still following the movement of the stock market to some extent. The traditional belief is that bonds can offer diversification to manage risk. We haven’t found that to be the case for several years now. Bonds may be starting to act this way again. The real test will be to see what they do the next time the stock market has a larger, more meaningful sell-off. Will they help smooth results? In 2022, they didn’t come close.
Bottom Line: We haven’t seen much volatility in the past few months as we would have expected. But we also never saw a reason to do much selling. The theme has been to stay the course until the market sees a reason to be cautious. That just hasn’t happened, so staying largely invested has been the play. As we move into a stronger portion of the year, we will be looking for opportunities to lean a bit more into risk assets as it seems appropriate.
Stay safe out there!

1 The Standard and Poor’s 500 is an unmanaged, capitalization-weighted benchmark that tracks broad-based changes in the U.S. stock market. This index of 500 common stocks is comprised of 400 industrial, 20 transportation, 40 utility, and 40 financial companies representing major U.S. industry sectors. The index is calculated on a total return basis with dividends reinvested and is not available for direct investment.
2 Charts are for informational purposes only and are not intended to be a projection or prediction of current or future performance of any specific product. All financial products have an element of risk and may experience loss. Past performance is not indicative of future results.